Fig. 5.
Download original image
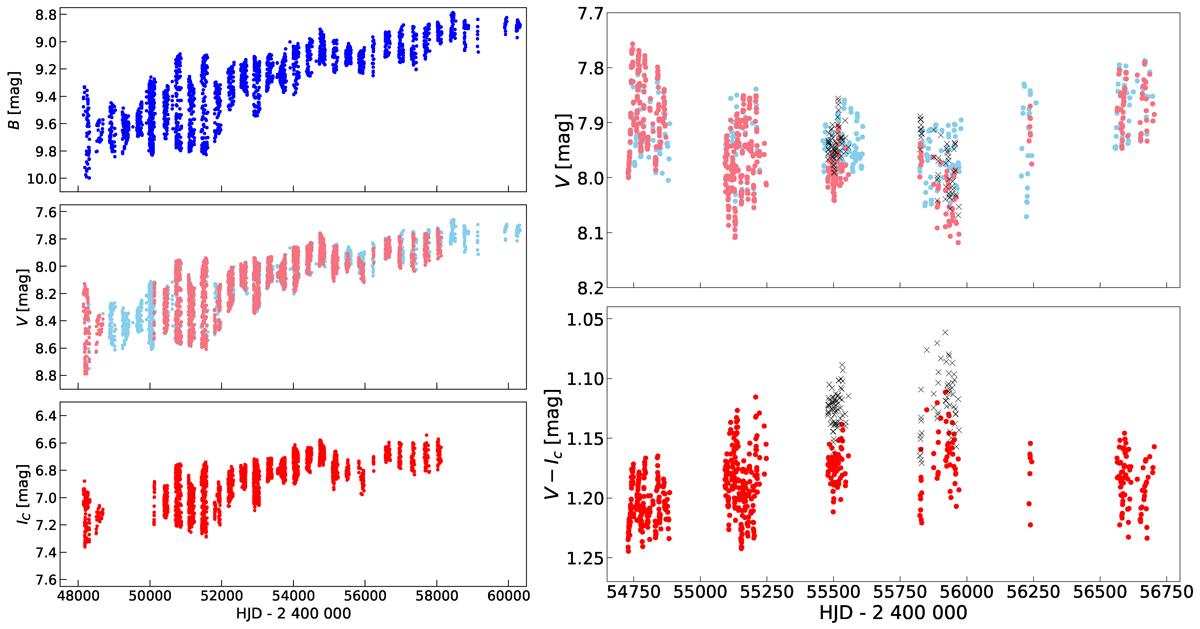
Left, from top to bottom: B, V, and IC data used for temperature determinations. In the middle panel showing V data, points measured simultaneously with B measurements are marked in light blue, and points measured simultaneously with IC measurements are marked in light red. Right: Enlarged view around discrepant V (upper panel) and V − IC (lower panel) data; data points corrected by 0![]() 05 are indicated by black crosses (for details, see the first paragraph of Sect. 4.3).
05 are indicated by black crosses (for details, see the first paragraph of Sect. 4.3).
Current usage metrics show cumulative count of Article Views (full-text article views including HTML views, PDF and ePub downloads, according to the available data) and Abstracts Views on Vision4Press platform.
Data correspond to usage on the plateform after 2015. The current usage metrics is available 48-96 hours after online publication and is updated daily on week days.
Initial download of the metrics may take a while.