Open Access
Fig. 9.
Download original image
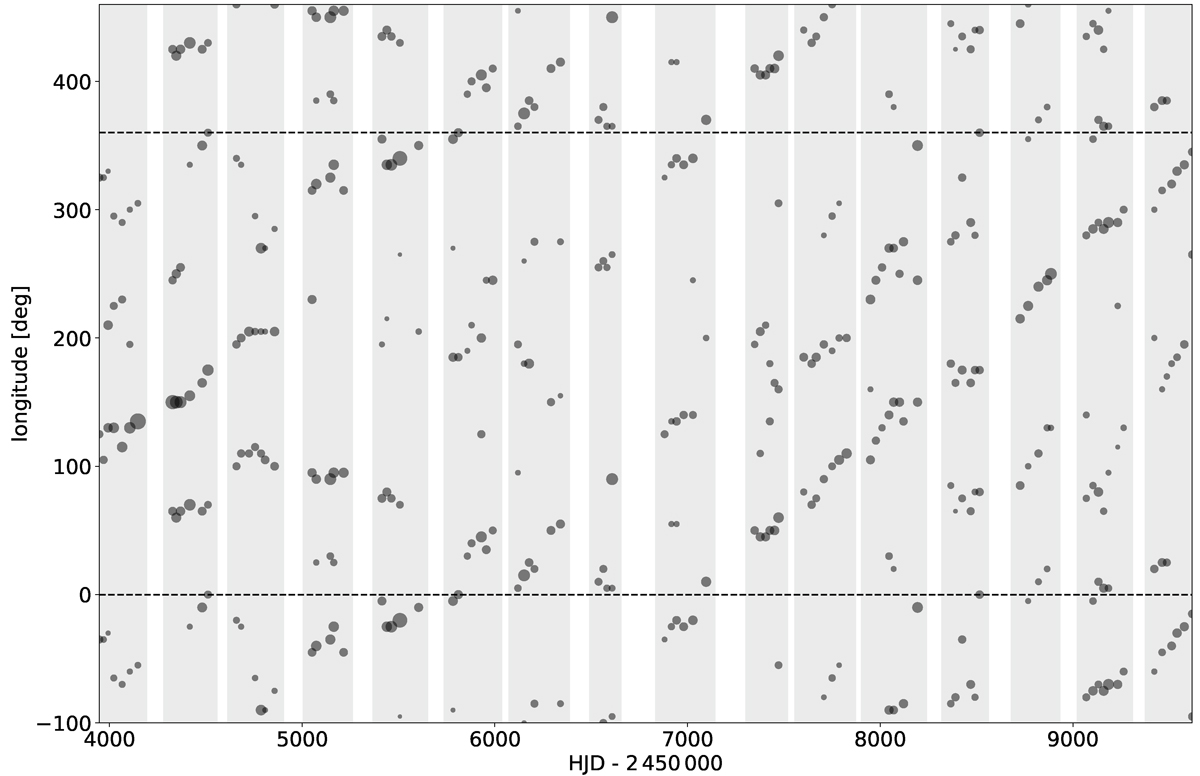
Longitudes of activity centres derived from 16 years’ of time-series Doppler images. We identified two or three activity centres per image. The larger the dot size, the more dominant the active longitude. Vertical grey bars indicate the separate observing seasons.
Current usage metrics show cumulative count of Article Views (full-text article views including HTML views, PDF and ePub downloads, according to the available data) and Abstracts Views on Vision4Press platform.
Data correspond to usage on the plateform after 2015. The current usage metrics is available 48-96 hours after online publication and is updated daily on week days.
Initial download of the metrics may take a while.