Fig. 4
Download original image
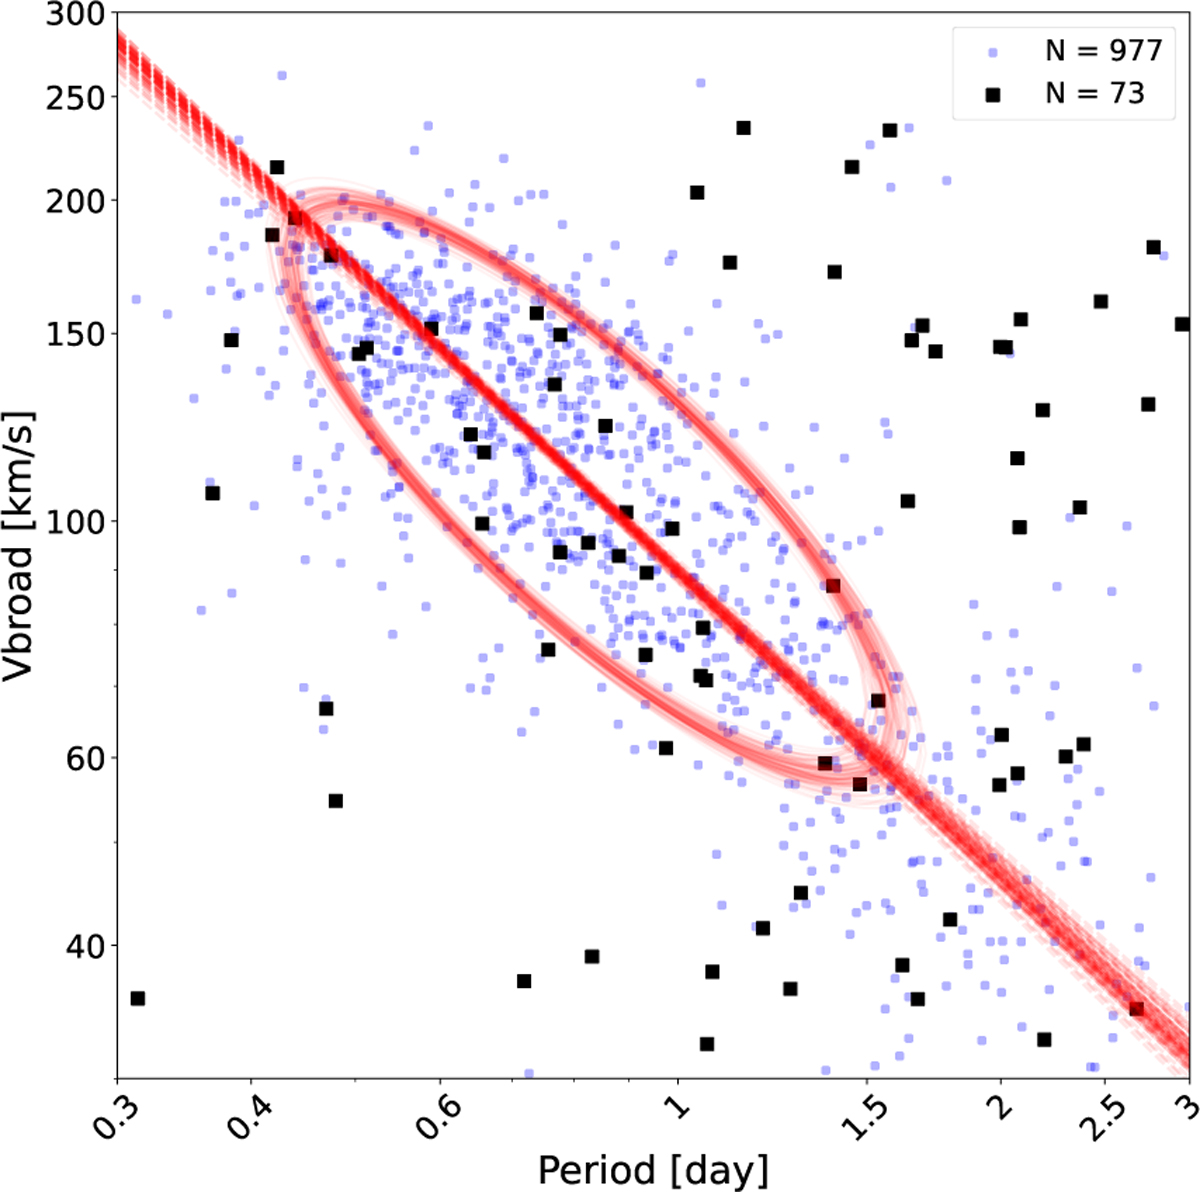
Rotated 2D Gaussian representing the distribution of EBs in the (vbroad, period) plane. Line equation: log V = A log P + B, where A = −0.948 ± 0.026 and B = 1.952 ± 0.005. Black squares mark systems with |e cos ω| > 0.1, which are not fitted by the algorithm. The plot shows 100 parameter sets sampled from the MCMC chains after convergence. The red lines represent the Gaussian’s major-axis orientation, and the red ellipses show the distribution 3σ region. A full derivation is provided in Appendix B.
Current usage metrics show cumulative count of Article Views (full-text article views including HTML views, PDF and ePub downloads, according to the available data) and Abstracts Views on Vision4Press platform.
Data correspond to usage on the plateform after 2015. The current usage metrics is available 48-96 hours after online publication and is updated daily on week days.
Initial download of the metrics may take a while.