Fig. 2.
Download original image
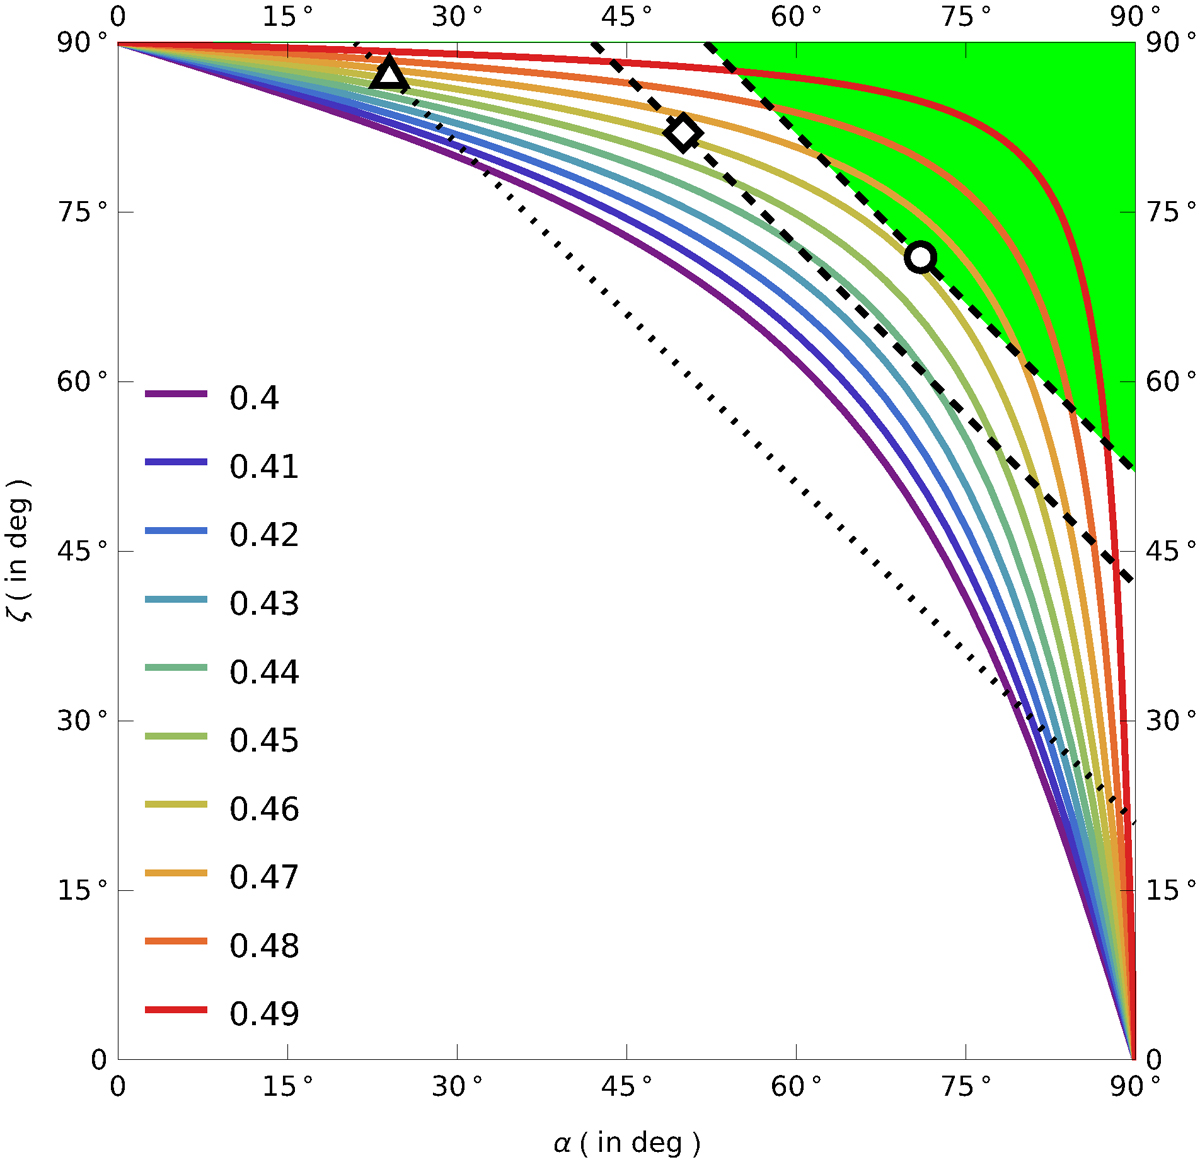
Constraints on the viewing angle and obliquity. For symmetry reasons, the other three quadrants are not shown. Colours indicate the value of the peak separation, Δ, from 0.41 in violet to 0.49 in red. The white circle, square, and triangle show the location of three possible fits to the γ-ray peak separation with (α, ζ) respectively as (71° ,71° ), (51° ,82° ), and (24° ,87° ). The green area highlights the region in the diagram where γ-ray emission is detected simultaneously with the radio pulse for (α, ζ) = (71° ,71° ). The other dashed and dotted line delimit the same region but for (α, ζ) = (51° ,82° ) and (α, ζ) = (24° ,87° ), respectively.
Current usage metrics show cumulative count of Article Views (full-text article views including HTML views, PDF and ePub downloads, according to the available data) and Abstracts Views on Vision4Press platform.
Data correspond to usage on the plateform after 2015. The current usage metrics is available 48-96 hours after online publication and is updated daily on week days.
Initial download of the metrics may take a while.