Open Access
Fig. 8.
Download original image
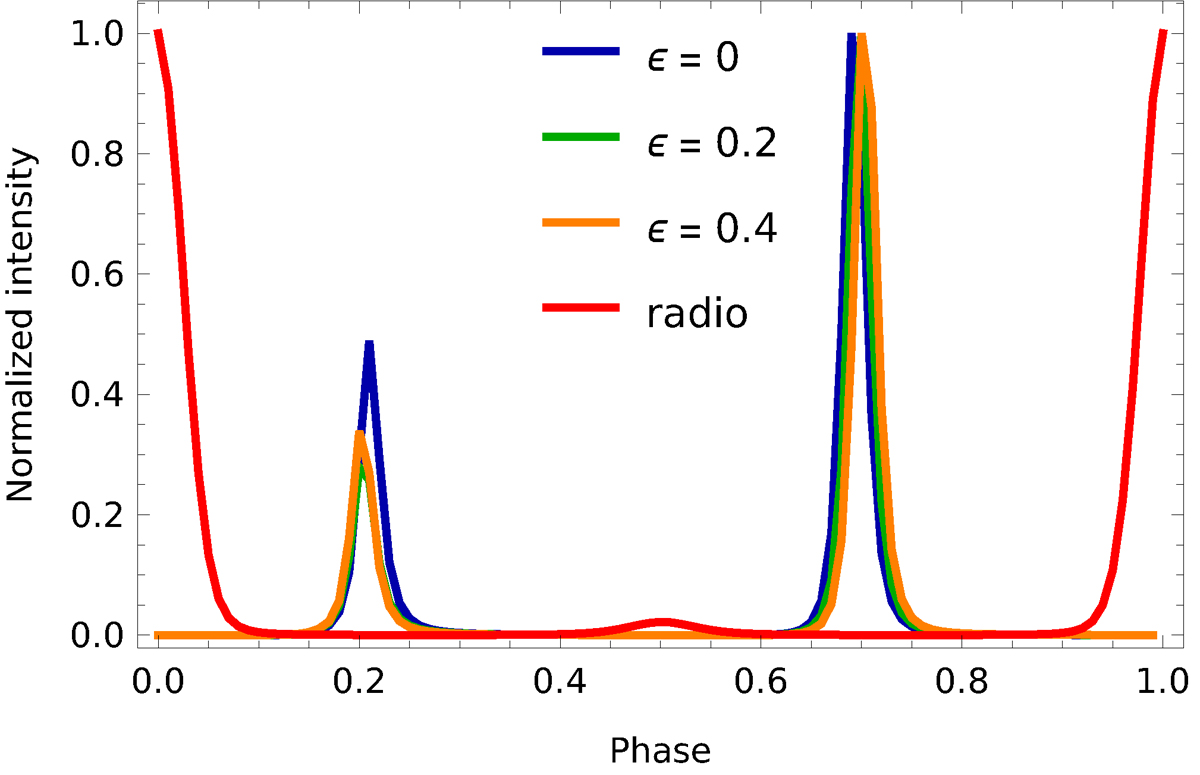
Comparison of the simulated γ-ray light curves between the centred dipole in blue and the off-centred dipole in green and orange for α = 70°, β = 0°, δ = 90°, and ϵ = 0.2. The line-of-sight inclination is ζ = 82°. The radio pulse profile is shown in red.
Current usage metrics show cumulative count of Article Views (full-text article views including HTML views, PDF and ePub downloads, according to the available data) and Abstracts Views on Vision4Press platform.
Data correspond to usage on the plateform after 2015. The current usage metrics is available 48-96 hours after online publication and is updated daily on week days.
Initial download of the metrics may take a while.