Fig. 1
Download original image
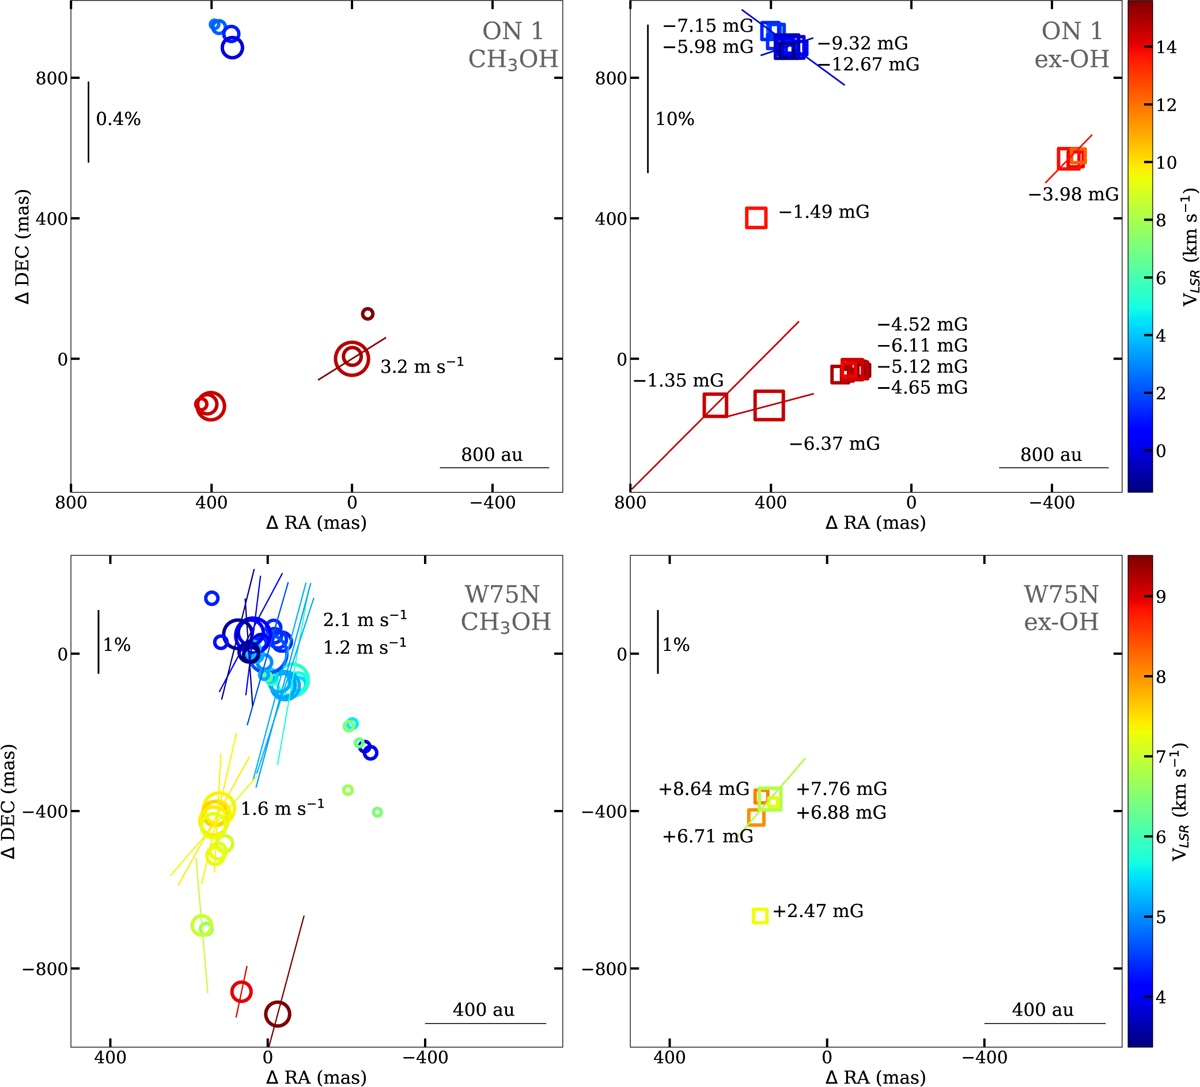
Distribution of 6.7 GHz CH3OH (left panels, circle symbols) and 6.035 GHz ex-OH (right panel, square symbols) maser features detected around ON 1 (top panels; ![]() ; Bronfman et al. 1996) and W75N (bottom panels;
; Bronfman et al. 1996) and W75N (bottom panels; ![]() ; Shepherd et al. 2003). The size of the symbols is scaled logarithmically according to their peak intensity (see Tables A.1–A.4), while their colors indicate the VLSR (see Tables A.1–A.4). The reference positions are RA(J2000)=20h 10m09s.04272±0s.00007 and Dec(J2000)=+31° 31′ 34′′.9736 ± 0′.0009 for ON 1; and RA(J2000)=20h 38m 36.41744 ± 0.00008 and Dec(J2000)=+42° 37′ 35′′.1153 ± 0′.0011 for W75N. The measured linear polarization vectors with their scales, the estimated
; Shepherd et al. 2003). The size of the symbols is scaled logarithmically according to their peak intensity (see Tables A.1–A.4), while their colors indicate the VLSR (see Tables A.1–A.4). The reference positions are RA(J2000)=20h 10m09s.04272±0s.00007 and Dec(J2000)=+31° 31′ 34′′.9736 ± 0′.0009 for ON 1; and RA(J2000)=20h 38m 36.41744 ± 0.00008 and Dec(J2000)=+42° 37′ 35′′.1153 ± 0′.0011 for W75N. The measured linear polarization vectors with their scales, the estimated ![]() , and the measured
, and the measured ![]() are also reported.
are also reported.
Current usage metrics show cumulative count of Article Views (full-text article views including HTML views, PDF and ePub downloads, according to the available data) and Abstracts Views on Vision4Press platform.
Data correspond to usage on the plateform after 2015. The current usage metrics is available 48-96 hours after online publication and is updated daily on week days.
Initial download of the metrics may take a while.