| Issue |
A&A
Volume 701, September 2025
|
|
|---|---|---|
| Article Number | A47 | |
| Number of page(s) | 11 | |
| Section | Planets, planetary systems, and small bodies | |
| DOI | https://doi.org/10.1051/0004-6361/202555591 | |
| Published online | 02 September 2025 | |
How the chemical composition of solids influences the formation of planetesimals
1
MAUCA – Master track in Astrophysics, Université Côte d’Azur & Observatoire de la Côte d’Azur, Parc Valrose,
06100
Nice,
France
2
Department of Physics, University College Cork,
Cork,
Ireland
3
Center for Star and Planet Formation, Globe Institute, University of Copenhagen,
Øster Voldgade 5–7,
1350
Copenhagen,
Denmark
4
Department of Physics, Muni University,
PO Box 725,
Arua,
Uganda
★ Corresponding author: This email address is being protected from spambots. You need JavaScript enabled to view it.
Received:
20
May
2025
Accepted:
11
July
2025
Abstract
The formation of planetesimals is a necessary step for the formation of planets. While several methods exist that can explain the formation of planetesimals, an increase in the local dust-to-gas ratio above unity is a strong requirement to trigger the collapse of the pebble cloud to form planetesimals. One prime location for this to happen is at the water-ice line, where large water-rich pebbles evaporate and release their smaller silicate cores, resulting in an increase in the local dust-to-gas ratio originating from the different inward velocities of the large and small pebbles. While previous work indicated that planetesimal formation becomes very challenging at overall dust-to-gas ratios below 0.6%, in line with the occurrence of close-in super-Earths, it is unclear how the overall disc composition influences the formation of planetesimals. Observations of stellar abundances not only indicate a decrease in the overall C/O ratio for low metallicity stars, they also show a large spread in the C/O ratios. However, the C/O ratio sets the abundance of water ice within the disc. Using the 1D numerical disc evolution code chemcomp, we simulated protoplanetary discs with varying C/O ratios and dust-to-gas ratios over a 3 Myr timescale. Planetesimal formation is modelled by implementing conditions based on dust-gas dynamics and pebble fragmentation. Our results confirm that planetesimal formation is highly dependent on disc metallicity with lower metallicity discs forming significantly fewer planetesimals. We find that a decreased carbon fraction generally enhances planetesimal formation, while a higher carbon fraction suppresses it due to a reduced water abundance at the same dust-to-gas ratio. The opposite is the case with the oxygen ratio, where larger oxygen fractions allow a more efficient formation of planetesimals at the same overall dust-to-gas ratio. Consequently we make the prediction that planets around low metallicity stars should be more common if the stars have low C/O ratios, especially when their oxygen abundance is increased compared to other elements, testable through observations. Our simulations thus open a pathway to understanding whether the composition of the planet-forming material influences the growth of planets.
Key words: accretion, accretion disks / planets and satellites: formation / protoplanetary disks / planet-disk interactions
© The Authors 2025
 Open Access article, published by EDP Sciences, under the terms of the Creative Commons Attribution License (https://creativecommons.org/licenses/by/4.0), which permits unrestricted use, distribution, and reproduction in any medium, provided the original work is properly cited.
This article is published in open access under the Subscribe to Open model. This email address is being protected from spambots. You need JavaScript enabled to view it. to support open access publication.
1 Introduction
Since the detection of the first planet around a main sequence star (Mayor & Queloz 1995), significant progress has been made into characterising the occurrence rates of exoplanets via the host star metallicity. Early studies focused on giant planets (Santos et al. 2004; Fischer & Valenti 2005; Johnson et al. 2010), due to the easier detectability of these planets.
The highly successful Kepler mission opened the window to also understanding the occurrence rates of smaller planets as a function of host star metallicity (e.g. Fressin et al. 2013; Mulders et al. 2018). Previous studies seem to indicate that planetary radius is a function of the host star metallicity (Buchhave et al. 2012; Buchhave et al. 2014; Petigura et al. 2018; Narang et al. 2018), where planets with smaller radii (below 2 Earth radii) should exist at a wide range of host star metallicities, while larger planets (above 4–5 Earth radii) are preferably found around stars with super-solar metallicity.
The smaller super-Earths and mini-Neptunes are common in systems with multiple planets (e.g. Weiss et al. 2018a,b; Millholland & Winn 2021), where these systems can sometimes harbour planets in mean-motion resonances (Mills et al. 2016; Gillon et al. 2017). The formation of these planets can be explained by inward migration and a consequent breaking of the resonances chains that are built during inward migration (Izidoro et al. 2017; Izidoro et al. 2021a; Bitsch & Izidoro 2023, 2024). Interestingly, observations seem to indicate that compact multi-planet systems are more common around metal-poor stellar hosts (Brewer et al. 2018), which could be explained by fewer instabilities caused by the absence of giant planets around low metallicity stars (e.g. Bitsch & Izidoro 2023).
However, at even lower host star metallicities, [Fe/H]<−0.5, the occurrence rate of planets drops significantly (Boley et al. 2024). This thus introduces an interesting test-bed for planet formation theories regarding the metallicity limit at which planet formation can still operate.
Planet formation requires the formation of at least some planetesimals, where the final growth to planets can then happen either via planetesimal or pebble accretion (e.g. Drążkowska et al. 2023). It is thus crucial to understand the formation of planetesimals within the low metallicity limit. While detailed simulations of the streaming instability (e.g. Johansen & Youdin 2007; Johansen et al. 2015; Carrera et al. 2015; Simon et al. 2016) provide a great deal of information regarding what conditions are necessary to form planetesimals (e.g. particle size, local dust-to-gas ratio), they cannot cover the evolution and formation of planetesimals over several 100 kyr due to their complex computational requirements.
While several planetesimal formation mechanisms for 1D models exist in the literature (e.g. Drążkowska & Alibert 2017; Carrera et al. 2017; Lenz et al. 2019), we focus here on the formation of planetesimals at the water ice line (Drążkowska & Alibert 2017). The underlying idea is that larger water ice particles (with silicate cores) drift inwards very rapidly; once they cross the water ice evaporation front, they release their water into the vapour phase, while their smaller silicate cores move slowly inwards. Due to the velocity difference between large and small grains (Weidenschilling 1977; Brauer et al. 2008), a build-up of solids develops around the water ice line. This can increase the local dust-to-gas ratio above unity and trigger the formation of planetesimals. In our previous work (Andama et al. 2024), we included the recipe for planetesimal formation by Drążkowska & Alibert (2017) and found that planetesimal formation below [Fe/H] < −0.5 in a smooth disc is very challenging, if possible at all, in line with the observational constraints (Boley et al. 2024).
However, a crucial ingredient that is still missing in these models is the abundance of the different elements (e.g. Fe, Mg, Si, O, C) that contribute significantly to the growth of planets scale differently with [Fe/H] (e.g Buder et al. 2021), due to the different galactic production sites (Burbidge et al. 1957). For example, the α-elements are normally enriched compared to iron at low metallicity, indicating that this enrichment may compensate for the lower iron abundance (Adibekyan et al. 2012). Consequently, planets orbiting stars with lower iron fractions should thus also be less iron rich (Adibekyan et al. 2021). However, in total this process should not influence the formation of planetesimals or planets as it should not matter whether a planet accretes iron-rich or iron-poor pebbles as long as there is enough material available to allow the growth of the planet.
On the other hand, as planetesimals can form close to the water ice line, the total water abundance could influence the growth of planetesimals. Observations of stars indicate that the stellar C/O ratio decreases with decreasing [Fe/H], which gives rise to a higher water abundance at low [Fe/H] (Bitsch & Battistini 2020). Previous simulations already indicated that a larger water fraction could allow a more efficient formation of giant planets by pebble accretion (Bitsch & Johansen 2016). This is caused by the enlarged opacity exterior to the water ice line, which results in a higher aspect ratio that ultimately increases the pebble isolation mass (Lambrechts et al. 2014; Bitsch et al. 2018; Ataiee et al. 2018). The larger cores allow a more efficient accretion of gas, resulting in a more efficient formation of gas giants compared to discs, which are dominated by silicates. However, it is unclear how a change in the water abundance would influence the formation of planetesimals.
For this work we investigated how the chemical composition of the disc via the C/O ratio–which ultimately sets the water ice abundance–influences the growth of planetesimals. This essentially corresponds to the stage of embryo formation before the effects described by Bitsch & Johansen (2016) could take place. While the trend that stars with lower [Fe/H] have a higher water abundance seems clear (Bitsch & Battistini 2020; Cabral et al. 2023), there is a large spread in the data, justifying a more detailed investigation. We used a simple 1D disc model including pebble growth and drift that allows the formation of planetesimals at the water ice line, as in our previous work (Andama et al. 2024). Here we investigated a variation of the C/O ratio in the disc at the different metallicities. This allowed us to probe how the water abundance influences the formation of planetesimals even if the overall metallicity is the same. We focused here in particular on systems with sub-solar metallicities to disentangle the importance of the water fraction for the formation of planetesimals in the limits where planet formation might not be efficient any more.
Our paper is structured as follows. In Section 2 we discuss our methods and present the corresponding results at high and low C/O ratios in Section 3. We then discuss the implications of our results in Section 4 and summarise in Section 5.
2 Methods
We utilise chemcomp, a one-dimensional code simulating a protoplanetary disc’s evolution, from dust growth and accretion to planetesimals, planet formation, and migration (Schneider & Bitsch 2021). We briefly state how we modelled the disc’s evolution, and how we include the formation of planetesimals. We then discuss our chemical model before discussing the parameters we use in our simulations.
2.1 Disc evolution and planetesimal formation
chemcomp models the one-dimensional disc using a viscous evolution model (Shakura & Sunyaev 1973), with the viscocity given by
![Mathematical equation: $\[\nu=\alpha_t \frac{c_s^2}{\Omega_K},\]$](/articles/aa/full_html/2025/09/aa55591-25/aa55591-25-eq1.png) (1)
(1)
with cs the isothermal sound speed in the disc’s medium, ![Mathematical equation: $\[\Omega_{k}= \sqrt{\frac{G M_{*}}{r^{3}}}\]$](/articles/aa/full_html/2025/09/aa55591-25/aa55591-25-eq2.png) the Keplerian angular frequency, and αt a dimensionless factor describing the level of turbulence in the disc. As the disc temperature profile remains the same in time for the duration of the simulations presented below, the sound velocity and by extension the viscosity profiles remain constant in time in each simulation. Varying viscosities are thus probed by variations in the αt parameter.
the Keplerian angular frequency, and αt a dimensionless factor describing the level of turbulence in the disc. As the disc temperature profile remains the same in time for the duration of the simulations presented below, the sound velocity and by extension the viscosity profiles remain constant in time in each simulation. Varying viscosities are thus probed by variations in the αt parameter.
The temperature profile in our disc is calculated via an equilibrium between viscous and stellar heating with radiative cooling (Schneider & Bitsch 2021) at the beginning of each simulation. For simplicity, we do not evolve the temperature of the disc in time. The disc’s surface density is calculated from the initial disc mass and radius in a self-consistent manner corresponding to the steady-state solution of viscous discs. Consequently the disc harbours a radial pressure gradient, which in turn results in a sub-Keplerian velocity of the gas.
The growth and evolution of the dust particles is modelled via the two-population approach (Birnstiel et al. 2012), where small dust grains grow to millimetre-centimetre-sized pebbles. These particles want to orbit at a Keplerian velocity, and thus feel a head wind from the gas, which results in efficient inward movement of the millimetre–centimetre-sized pebbles (Weidenschilling 1977; Brauer et al. 2008). The exact velocity of the pebbles depends on the Stokes number of the particles, which essentially describes how well coupled the particles are to the gas. Particles with small Stokes numbers (of the order of <10−4) are perfectly coupled to the gas and move at the gas velocity, while large particles decouple from the gas and move inwards much more efficiently. The Stokes number within the Epstein drag regime for spherical particles can be written as
![Mathematical equation: $\[\mathrm{St}=\frac{a_{\mathrm{p}} \rho_s}{\Sigma_g} \frac{\pi}{2},\]$](/articles/aa/full_html/2025/09/aa55591-25/aa55591-25-eq3.png) (2)
(2)
with ap and ρs the radius and density of the particle, respectively, and Σg the surface density of the gaseous environment.
The growth (and thus the drift) of particles is limited by the fragmentation velocity, which essentially describes how fast particles can collide so that they can still stick and grow. Once the velocity of the particles becomes larger, they fragment and the growth process is stopped. The fragmentation velocity is dependent on the composition of the particles and here ufrag = 1 m/s is considered for silicates and ufrag = 10 m/s for water ice (Gundlach & Blum 2015). This results in a large change of the particle sizes at the water ice line as they depend quadratically on the fragmentation velocity uf:
![Mathematical equation: $\[a=\frac{2}{3 \pi} \frac{\Sigma_{\mathrm{d}}}{\rho_{\mathrm{s}} \alpha_{\mathrm{t}}} \frac{u_{\mathrm{f}}^2}{c_{\mathrm{s}}^2}.\]$](/articles/aa/full_html/2025/09/aa55591-25/aa55591-25-eq4.png) (3)
(3)
This effectively results in a change in the particle size by a factor of 100 when the fragmentation velocity changes from 10 to 1 m/s at the water ice line.
This process is of great interest in planetesimal formation, as an abrupt switch in the fragmentation velocity occurs at the water evaporation line, which is within a very small area within the disc. Suddenly the particles reduce in size as they fragment, and they couple more to the gas as their Stokes number goes down, forming a traffic jam of solid particles in the area. This traffic jam around the water ice line can lead to the formation of planetesimals (e.g. Drążkowska & Alibert 2017). They give a simple estimate for the formation of planetesimals,
![Mathematical equation: $\[\dot{\Sigma}_{\mathrm{pla}}=\zeta \cdot \Sigma_{\mathrm{d}} \cdot \Omega_k,\]$](/articles/aa/full_html/2025/09/aa55591-25/aa55591-25-eq5.png) (4)
(4)
with ζ the efficiency of the formation, equal to 10−3, Σd the surface density of the dust, and Ωk the Keplerian frequency. Planetesimal formation occurs when the condition laid out by Li & Youdin (2021) are met:
The pebble Stokes number is St ≥ 10−3;
The mid-plane dust-to-gas ratio is ϵ ≥ 1.
Here, the mid-plane dust-to-gas ratio is computed as
![Mathematical equation: $\[\epsilon=\frac{\Sigma_{\mathrm{d}}}{\Sigma_{\mathrm{g}}} \sqrt{\frac{\alpha_z+\mathrm{St}}{\alpha_z}},\]$](/articles/aa/full_html/2025/09/aa55591-25/aa55591-25-eq6.png) (5)
(5)
where Σd and Σg is the surface density of the dust and gas, respectively; St is the Stokes number; and αz is the vertical settling parameter, a unit-less factor that describes the vertical component of the disc turbulence, which is kept constant for all simulations and is equal to 10−4.
2.2 Chemical model
The solar elemental abundances (Asplund et al. 2009) that are used in the disc are listed in Table 1; the individual elements are then distributed in the different molecules, as listed in Table 2. We use here a reduced chemical partitioning model compared to Schneider & Bitsch 2021, as the stellar abundances used as motivation for our model do not contain N, Na, Ti, V, Al, and S. The large refractory carbon fraction represents the organics in our model, which are thought to hold the largest contributions (Mathis et al. 1977; Zubko et al. 2004; Gail & Trieloff 2017).
The C/O ratio of the disc is derived using the abundances in Table 1 and the scaling of Bitsch & Battistini (2020), which originate from the mean values extracted from the Galactic Archaeology with HERMES (GALAH) survey (Buder et al. 2018). In order to explore the parameter space for higher and lower C/O ratios, a C/O value ±0.25 from the mean C/O was selected at each [Fe/H]. The C/O ratio of the disc can be tuned by carefully selecting the [C/H] or [O/H] abundance:
![Mathematical equation: $\[[\mathrm{C} / \mathrm{H}]=~\log _{10}\left(\frac{\mathrm{O} / \mathrm{H}}{\mathrm{C} / \mathrm{H}}\right)+~\log _{10}(\mathrm{C} / \mathrm{O})+[\mathrm{O} / \mathrm{H}],\]$](/articles/aa/full_html/2025/09/aa55591-25/aa55591-25-eq7.png) (6)
(6)
![Mathematical equation: $\[[\mathrm{O} / \mathrm{H}]=~\log _{10}\left(\frac{\mathrm{C} / \mathrm{H}}{\mathrm{O} / \mathrm{H}}\right)-~\log _{10}(\mathrm{C} / \mathrm{O})+[\mathrm{C} / \mathrm{H}].\]$](/articles/aa/full_html/2025/09/aa55591-25/aa55591-25-eq8.png) (7)
(7)
Here O/H and C/H are the elemental abundances of O and C, listed in Table 1, C/O is the number ratio of C to O, and [O/H] and [C/H] are the abundances of O and H in dex notation.
Our aim is to vary the C/O ratio within the disc, which can be varied by either changing the overall carbon or overall oxygen abundances. This then results in different [C/H] and [O/H] values for the same C/O. The corresponding [C/H] and [O/H] abundances calculated for the C/O ratios of interest (±0.25 from the mean value) are listed in Table 3.
As we only have the data for reliable C/O ratios down to [Fe/H] = −0.4, we adopted the same C/O ratios (and derivations thereof) for even lower dust-to-gas ratios. A change in the C/O ratio will result in a change of the overall water abundance in the disc. If there is less carbon available, more oxygen will be free to form water, while a larger C/O ratio will result in less water, as more oxygen is bound in CO and CO2. We note that variations of the Mg and Si abundances will also change the disc’s water content; however, changes in the carbon and oxygen fraction will have a larger influence due the larger amount of oxygen and carbon (see Table 1 and Cabral et al. 2023).
In addition, the two different methods used to change the C/O ratio (either increasing the carbon or oxygen abundance) have different consequences for the amount of water as well. If the overall oxygen abundance is increased (to mimic a lower C/O ratio), the overall mass of all other elements has to be reduced for a constant dust-to-gas ratio. Consequently, a low C/O ratio realised by a high oxygen content will feature more water, compared to a low C/O ratio that is realised by decreasing carbon, as this increases the amount of all other solids (and not only water), which also bind oxygen (see Table 2). We show the water ice fractions in our model in more detail in Appendix B.
Elemental abundances of the modelled disc.
Distribution of the elements into molecules within the modelled disc.
Dust-to-gas ratios tested for varying C/O ratios.
2.3 Disc parameters
In our model the stellar mass, disc mass, and disc radius were kept constant throughout, as we wanted to investigate the influence of the chemical composition on planetesimal formation. In particular we used a solar mass star with a disc that corresponds to a 10% solar mass disc, which is on the heavier side of protoplanetary discs. We chose this value as we wanted to test the limits of planetesimal formation at low metallicity. Our previous work indicated that the efficiency for planetesimal formation (defined as how much mass of the dust is converted into planetesimals) is slightly higher in higher mass discs (Andama et al. 2024) and can be up to 50%, depending on the disc’s viscosity. The turbulent viscosity of the disc was varied between 10−3 and 10−4 and the vertical settling parameter of the disc was kept constant at αz = 10−4 (Pinilla et al. 2021).
The stellar metallicity, which is assumed to also be that of the disc, was set at [Fe/H] = 0 and two sub-solar values, −0.2 and −0.4, before we investigated even lower dust-to-gas ratios. The remaining elemental abundances are from the scaling law described in Bitsch & Battistini (2020). In this model, only Fe, O, C, Si, S, and Mg were assumed to exist in substantial quantities, while we neglected other species. With the elemental abundances under consideration in the model, the initial dust-to-gas ratio (DTG) of the disc is then given by
![Mathematical equation: $\[\mathrm{DTG}=\sum \mathrm{X} / \mathrm{H} \cdot \mu_x \cdot 10^{[\mathrm{X} / \mathrm{H}]}\]$](/articles/aa/full_html/2025/09/aa55591-25/aa55591-25-eq9.png) (8)
(8)
with X/H the initial abundance of element X (Asplund et al. 2009), μx the atomic mass of element X, and [X/H] the abundance of element X (Bitsch & Battistini 2020) in dex units. This gives a dust-to-gas ratio of ≈1.6% for [Fe/H] = 0.0.
In addition to the dust-to-gas ratios computed in the previous manner, four lower DTG values were chosen to model very low DTG ratio discs and explore the lower limits of planetesimal formation. The chemical abundances and C/O ratio selected in these cases are identical to the [Fe/H] = −0.4 case, in accordance with the trends from Bitsch & Battistini (2020). We list our chosen disc parameters in Table 4.
Disc parameters used in this work.
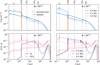 |
Fig. 1 Solid surface density of pebbles and planetesimals (top) in a disc with [Fe/H] = −0.4 and the median C/O ratio for α = 10−3 (left) and α = 10−4 (right) as a function of time. The bottom panels depict the Stokes numbers of the pebbles as well as the mid-plane dust-to-gas ratio. Initially, the particles are micrometre sized, with Stokes numbers below 10−4 within ~100 AU. |
3 Planetesimal formation
In this section we discuss the results of our simulations. We focus here mainly on the results at overall low metallicity ([Fe/H] = −0.4, corresponding to a dust-to-gas ratio of 0.8%) and present our results for solar metallicity in Appendix A. We first vary the C/O ratio by changing the carbon abundance and then vary the C/O ratio by varying the oxygen abundance.
3.1 [Fe/H] = −0.4
We show in Fig. 1 the time evolution of the pebble and planetesimal surface density and of the Stokes number and mid-plane dust-to-gas ratio in discs with different viscosities for our median C/O ratio. We focus here mostly on the first 100–500 kyr, where planetesimal formation is efficient in our model.
The initial dust-to-gas ratio is below 1% at the water ice line due to our initial conditions. Initially, the discs consist of micrometre-sized grains, with low Stokes numbers (bottom of Fig. 1), but they soon start to grow via coagulation from the inside out. Once the dust grows to millimetre–centimetre-sized pebbles, their Stokes number increases to the order of 10−3−10−2 and they drift inwards efficiently. However, once they cross the water ice line, their size changes by a factor of 100 due to the changes in the fragmentation velocity from 10 m/s to 1 m/s (Eq. (3)). Consequently, a pile-up of material is generated at the water ice line, increasing the mid-plane dust-to-gas ratio above unity, which allows the formation of planetesimals at that position.
In time, the dust in the outer regions of the disc has also grown to pebble sizes and drifted inwards. As a consequence, the pebble flux reduces in time. Once the pebble flux is reduced, the dust-to-gas ratio in the mid-plane regions of the disc decreases below unity. Consequently planetesimal formation stops.
This directly implies that the formation efficiency of planetesimals at the water ice line is regulated by the efficiency of the inward drift of pebbles. The surface density of the formed planetesimals in Fig. 1 is higher for the simulations with higher viscosity. This is caused by the fact that the pebble sizes in this case are smaller (Eq. (3)), and thus drift inwards more slowly. Consequently, a slightly lower pebble flux (compared to lower viscosities) can be maintained for longer (see also Bitsch & Mah 2023). In combination with the low vertical turbulence (fixed at αz = 10−4), the pebble flux is still high enough to generate a mid-plane dust-to-gas ratio above unity, resulting in planetesimal formation that can happen for a longer period of time. We thus observe a more efficient planetesimal formation at the water ice line at higher viscosity, in line with Andama et al. (2024).
In Fig. 2 we show the evolution of the pebbles and planetesimals for discs with lower C/O ratios (left) and higher C/O ratios (right). We note that we use here the same [Fe/H] value (and thus the same dust-to-gas ratio) as in Fig. 1. In principle we observe the same phenomena as for the simulations with the median C/O ratio: the pebbles drift inwards, the dust-to-gas ratio at the water ice line increases above unity, and planetesimals can form. Once the pebble flux decreases, planetesimal formation stops. Independently of the C/O ratio, we see that planetesimal formation is more efficient at higher viscosity, caused by the slightly smaller pebbles that can maintain the pebble flux for a longer time, resulting in a longer time for planetesimal formation.
A lower C/O ratio results in a larger water fraction compared to the higher C/O ratio (Bitsch & Battistini 2020). Consequently, our simulations show a higher surface density in planetesimals at the water ice line for the simulations with lower C/O ratios.
We show in Fig. 3 the mass evolution of dust and pebbles and of the planetesimals for discs with [Fe/H] = 0.0, −0.2, and −0.4. As in previous works by Andama et al. (2024) and as discussed above, the simulations with higher viscosity form more planetesimals at all [Fe/H] values as planetesimal formation can be maintained for a longer period of time.
In addition, the simulations with low C/O ratios form planetesimals more efficiently at the same total dust-to-gas ratio. As described above, this is caused by the larger water fraction at lower C/O ratio. We note that a higher C/O ratio results in a larger CO and CO2 fraction. However, this increase in CO and CO2 is not sufficient to trigger planetesimal formation in the outer disc as no pebble pile-up can be achieved. The large pebble pile-up around the water ice line is caused not only by the water fraction, but also by the change in the grain fragmentation velocity from 10 to 1 m/s, reducing the grain sizes by a factor of 100. This results in a traffic jam of dust at the water ice line, required to reach local solid-to-gas ratios of unity that allow the formation of planetesimals. In order to achieve a large enough pile-up of material at the CO and CO2 snow lines, super-solar metallicities are required (see Andama et al. 2024).
3.2 Lower dust-to-gas ratios
In Fig. 4 we show the time evolution of the dust and pebbles and of the formed planetesimals for simulations with even lower dust-to-gas ratios. The simulations with low viscosity (αt = 10−4) only produce a very tiny amount of planetesimals at dust-to-gas ratios of 0.7 and 0.6%, and nothing below these dust-to-gas ratios, independently of the C/O ratio of the material. Clearly, planet formation by pure planetesimal accretion will be troublesome at dust-to-gas ratios of 0.7 and 0.6%. On the other hand, a formation of super-Earths assisted by pebble accretion and giant impacts might be possible, even at these low pebble fluxes (e.g. Lambrechts et al. 2019).
On the other hand, as discussed above, the higher viscosity (αt = 10−3) maintains the pebble flux (and a mid-plane dust-to-gas ratio above unity) for a longer time, and thus allows a more efficient planetesimal formation at the water ice line. In particular for a dust-to-gas ratio of 0.7 and 0.6%, our simulations predict a ring of planetesimals at the water ice line of more than 5–10 Earth masses, which is enough to form super-Earths, even with pure planetesimal accretion (Izidoro et al. 2021b; Batygin & Morbidelli 2023; Shibata & Izidoro 2025). Our simulations also show a clear dependence on the amount of planetesimals that are formed as a function of the C/O ratio. At a dust-to-gas ratio of 0.6%, the simulations with high C/O ratio fail to form any planetesimals, due to the low water content that prevents planetesimal formation at the water ice line.
At a dust-to-gas ratio of 0.5% our simulations only show a small number of planetesimals that are formed, and only at low C/O ratios where the water content is greater compared to the simulations with higher C/O ratios. The number of planetesimals formed at this dust-to-gas ratio would be too low to form planets by planetesimal accretion, but planets could also grow by pebble accretion and giant impacts during or after the gas disc phase.
We show in Fig. 5 the total masses of planetesimals that are formed in our simulations. As discussed above, the final mass in planetesimals is essentially negligible below solar metallicity in low turbulence discs, while discs with higher turbulence can form planetesimals at lower dust-to-gas ratios. The trend that planetesimals form more efficiently with lower C/O ratios is clearly visible.
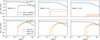 |
Fig. 3 Pebble and planetesimal mass evolution for discs with different [Fe/H] values (left to right) and different viscosities (top to bottom). The different line styles correspond to different C/O ratios, which influence the disc’s water content and consequently planetesimal formation. |
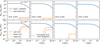 |
Fig. 4 Same as Fig. 3, but for even lower dust-to-gas ratios, where the limit of no planetesimal formation is reached, depending on the initial C/O ratio and initial dust-to-gas ratio. |
3.3 Changing the total oxygen abundance
The C/O ratio within the disc can also be changed by changing the oxygen abundances. We describe above how we changed the C/O ratio by changing the carbon fraction, while we now change the oxygen abundance in the disc to manipulate the C/O ratio. This has consequences for the water content within the disc. Low C/O ratios imply an increase in the oxygen abundance. The total abundance of all other elements then has to decrease as the dust-to-gas ratio remains fixed. Consequently, more water is available, influencing the formation efficiency of planetesimals at the water ice line.
In Fig. 6 we show the dust and pebbles as well as planetesimal mass as a function of time for low dust-to-gas ratios for different viscosities. In Fig. 7 we show the total planetesimal mass that is formed in our simulations.
Our simulations show the same trend as before, that discs with low turbulence do not form planetesimals, while discs with higher levels of turbulence form planetesimals more efficiently, especially if the C/O ratio is lower. A notable difference compared to the previous simulations is that at a dust-to-gas ratio of 0.5% several Earth masses of planetesimals formed at low C/O ratio, in contrast to the simulations with high C/O ratio. These masses could be high enough to form planets even by planetesimal accretion alone (Izidoro et al. 2021b; Batygin & Morbidelli 2023; Shibata & Izidoro 2025). Consequently, the trend that planetesimal formation (and thus planet formation) at low metallicity is influenced by the disc’s C/O ratio (and thus water content) also holds in this scenario.
We note that the formation efficiency of planetesimals at solar metallicity is also influenced by the overall C/O ratio. However, we expect that this will not make a significant difference in the formation of planets because a very large number of planetesimals (above a few tens of Earth masses) are formed in any case, allowing the very efficient formation of planets in all cases.
 |
Fig. 5 Planetesimal mass (in Earth masses) formed in discs with different initial dust-to-gas ratios as well as different C/O ratios. The change of the C/O ratio is achieved by changing the carbon grain fraction. The left panel depicts simulations with high viscosity, while the right panel shows simulations with low viscosity. |
4 Discussion
4.1 Formation at pressure perturbations
The size difference between the particles interior and exterior to the water ice line results in an opacity difference at the region, which consequently gives rise to a very steep radial temperature gradient. This could then cause a pressure perturbation in the disc (Müller et al. 2021). Within this pressure perturbation, pebbles could accumulate and the formation of planetesimals could be triggered (e.g. Johansen et al. 2007). In addition, observations indicate that protoplanetary discs harbour sub-structures where particles could accumulate, eventually allowing the formation of planetesimals and planets within these sub-structures (Morbidelli 2020; Sándor et al. 2024). However, it is unclear how these sub-structures are generated (see e.g. Bae et al. 2023) and when they appear in protoplanetary discs.
From a mass budget perspective, even a disc with a dust-to-gas ratio of only 0.5% harbours around 150 Earth masses of solids if the disc was initially 10% the mass of the sun. If all of this pebble mass were to accumulate in one ring, clearly enough planetesimals could be formed to facilitate the formation of planets in this scenario, in contrast to the simulations we present here that feature a smooth disc without any initial perturbations.
If sub-structures are common and allow the efficient formation of planetesimals and planets, this opens the question of why there is a lower limit in the [Fe/H] at around approximately −0.5 for the occurrence rate of planets. Massive discs with even lower dust-to-gas ratios than 0.5% should harbour enough mass to form planetesimals and planets, if it is all accumulated within one ring. Clearly there are several possible answers to this question, where the obvious answer is that discs are on average much smaller than 10% of the stellar mass (e.g. Guerra-Alvarado et al. 2025). Reducing the disc mass to something like the minimum mass solar nebula (Weidenschilling 1977; Hayashi 1981), corresponding to roughly 1% of the solar mass, reduces the total solid mass to only 15 Earth masses, when considering a 0.5% metallicity, where even the ring formation scenario runs into trouble. In addition, most close-in super-Earths and mini-Neptunes are found around M- and K-dwarf stars, which have a lower mass and consequently a lower disc mass and total solid mass budget.
Alternatively, the question remains of when the sub-structures are generated in the protoplanetary discs. Observations seem to indicate that class 0 discs have mostly no detected sub-structures (Ohashi et al. 2023), while the fraction of discs with sub-structures increases towards class I and class II sources (Hsieh et al. 2024, 2025). In this case though, the majority of the pebbles might have already drifted inwards, leaving only lower masses of pebbles available to form planetesimals at pressure perturbations.
It is thus clear that this question can only be answered if the initial disc mass function is known. As it stands, it seems that the lack of planets at low [Fe/H] indicates formation within smooth discs, as the limits of planetesimal formation coincide with the limits of the occurrence rates of close-in planets or that the observed pressure perturbations–visible through gaps and rings–form too late to allow an efficient formation of planetesimals and planets.
4.2 Particle sizes
Our model predicts that planetesimal formation in discs with αt = 10−3 is more efficient compared to discs with a lower turbulence. This is related to the fact that the particle sizes in discs with higher turbulence are smaller (Eq. (3)), and consequently drift inwards more slowly, allowing the pebble flux to be maintained for a longer time. This implies that the mid-plane dust-to-gas ratio at the water ice line can be above unity for a longer time, giving a longer time during which planetesimals can form. As a result these simulations show a higher planetesimal mass.
However, this is based on a crucial assumption in our simulations: that the vertical level of turbulence, which determines the settling and thus the mid-plane dust-to-gas density (Eq. (8)), is low (αz = 10−4). This assumption is motivated by the study of Pinilla et al. (2021), who showed that a low vertical turbulence is needed to explain the observed concentration of large particles in the mid-plane of observed protoplanetary discs. If the level of vertical stirring and/or turbulence is higher, planetesimal formation will become more difficult or not happen at all, as the mid-plane dust-to-gas ratio does not exceed unity (Drążkowska & Alibert 2017; Andama et al. 2024). The question about the connection between the different assumed turbulences related to (i) vertical settling, (ii) disc viscous evolution, and (iii) grain fragmentation still remains open.
We note that the crucial parameter for a more efficient planetesimal formation, the particle size, could also be manipulated by different assumptions for the fragmentation velocity of the grains. In our model we assume 10 m/s for icy particles and 1 m/s for silicate particles, motivated by laboratory experiments (Gundlach & Blum 2015). However, it is still open if water ice particles really have a higher fragmentation velocity compared to silicate particles (e.g. Musiolik & Wurm 2019). It is clear though, that a small change in the fragmentation velocity of grains could compensate a change in the turbulence regarding the particle size (Eq. (3)). Consequently, we could recover the same grain sizes as in our αt = 10−3 simulations within simulations with αt = 10−4 by using a fragmentation velocity of ![Mathematical equation: $\[\sqrt{10}\]$](/articles/aa/full_html/2025/09/aa55591-25/aa55591-25-eq10.png) m/s rather than 10 m/s. We expect that planetesimal formation would then still be as efficient as in our nominal αt = 10−3 case. While a detailed study of how the fragmentation velocity impacts the formation of planetesimals is beyond the scope of this study, it is clear that the water abundance in the disc would still influence the formation of efficiency of planetesimals at the water ice line.
m/s rather than 10 m/s. We expect that planetesimal formation would then still be as efficient as in our nominal αt = 10−3 case. While a detailed study of how the fragmentation velocity impacts the formation of planetesimals is beyond the scope of this study, it is clear that the water abundance in the disc would still influence the formation of efficiency of planetesimals at the water ice line.
In principle CO and CO2 ice could be trapped inside water ice-rich pebbles and be transported into the inner disc regions. Recent studies with JWST imply that the trapped CO-to-water fraction is of the order of 15% (Bergner et al. 2024). However, the trapped CO ice would evaporate before the water ice line at around 130 K (Burke & Brown 2010), meaning it would not add to the pile-up of material at the water ice line. In addition, trapped CO ice would not re-condense at the water ice line, due to its lower evaporation front. We thus think these effects would be minimal in our model.
4.3 Implications for exoplanets and planet formation
Our simulations indicate that the formation of a ring of planetesimals at the water ice line is possible at low metallicity, in agreement with our previous simulations (Andama et al. 2024). Our simulations, however, do not include self-consistently the formation of planetary embryos, and thus of planets. In the inner region this process may take on the order of a hundred thousand years. (Voelkel et al. 2022). Only then would we expect significant planet-disc interactions to start, which could cause pressure perturbations. However, at this stage our simulations do not produce any planetesimals any more (see Fig. 3), indicating that the formation of planets would not significantly impact our result, especially at low metallicity where only a small number of planetesimals are formed in the first place (Figs. 5 and 7). However, we are interested here in the limits of planetesimal formation at low metallicity, where only a tiny amount of planetesimals is formed.
Our simulations predict a significant increase in planetesimals that could be formed at the water ice line in case of low C/O ratios, which indicates a large water ice content (Appendix B). This implies that there could be another layer related to the occurrence rate of planets at low metallicity, which has not been probed before: the overall C/O ratio coupled with a large water content. Our simulations show that planetesimal formation in general is very difficult at overall dust-to-gas ratios of ≤0.6%. However, at these low dust-to-gas ratios, our simulations show a significant increase in planetesimal formation at low C/O ratios, implying large water fractions. We thus expect that exoplanets detected around stars with low [Fe/H] should harbour a low C/O fraction as well and a large oxygen/water fraction. Our simulations thus show that the overall metallicity, which is determined by the summation over all elements, should be used to determine exoplanet occurrence rates in contrast to [Fe/H], which is normally used and does not contain any information about the total dust-to-gas ratio or the water fraction.
Detailed stellar abundance observations of exoplanet host stars at low [Fe/H] could thus be used to test our model. It is important to note that stars with low [Fe/H] are typically enriched in α-elements (Buder et al. 2021; Cabral et al. 2023), meaning that the overall metallicity has to be determined to allow a comparison to our model. Delgado Mena et al. (2021) studied the detailed stellar abundances of 1111 stars, including 152 planet host stars. They find that the stellar C/O ratio of exoplanet host stars (and stars without a detected planet) with [Fe/H] < −0.4 are of the order of 0.2–0.4, so within the range of the C/O ratios of our model (Table 3). However, we cannot draw a definite conclusion from their sample, as only a handful of planet host stars are within that range, making a statistical analysis impossible. However, the upcoming 4MOST survey (de Jong et al. 2019) will include a self-consistent determination of stellar abundances, including host stars, thus allowing us to test our predictions.
5 Summary and conclusion
We have presented here 1D simulations of inward-drifting pebbles that can form planetesimals at the water ice line. In particular we focused here on the difference of the planetesimal formation efficiency in discs with low dust-to-gas ratios with varying C/O ratios. We thus present the first set of simulations where planetesimal formation is directly influenced by the composition of material rather than just by the overall amount of available solids.
We confirm previous simulations (Andama et al. 2024) that find a lower limit in the overall dust-to-gas ratio for the formation of planetesimals in line with the drop in the occurrence rates of super-Earths (Boley et al. 2024). We also confirm that discs with overall higher levels of turbulence seem to form planetesimals more efficiently compared to discs with lower levels of turbulence. This is caused by the larger pebble sizes at low metallicities, which result in faster inward drift, reducing the time the disc can maintain a mid-plane dust-to-gas ratio above unity at the water ice line, thus reducing the amount of planetesimals that can be formed under the assumption of efficient vertical settling (Pinilla et al. 2021).
We find that lower C/O ratios-equivalent with higher water fractions–allow a more efficient formation planetesimals at the water ice line at the same overall dust-to-gas ratio. In particular, discs with dust-to-gas ratios below 0.6% can only form planetesimals at the water ice line for low C/O ratios in our simulations. This implies that planets found around stars with low metallicity should preferentially be found around stars with low C/O ratios, testable with future detailed observations. Our simulations thus open a pathway to understanding whether the chemical composition of planet-forming material influences the formation of planets.
Acknowledgements
K.O.X. thanks the Observatoire de la Côte d’Azur and the Erasmus+ program for making this joint research work possible. We thank the anonymous referee for the valuable comments that helped us to improve the overall quality of the paper.
Appendix A Solar Metallicity
Fig. A.1 shows the solid surface density of pebbles and planetesimals at solar metallicity for different viscosities as well as the corresponding Stokes numbers and mid-plane dust-to-gas ratios. We use here the solar C/O ratio. Independently of the disc’s viscosity, planetesimal formation at the water ice line is very efficient. Our here displayed results at correspond to the setup of Andama et al. (2024) and our simulations recover their results. Our simulations show a planetesimal formation efficiency of around ≈40% at high viscosity and ≈7% at low viscosity (see Fig. 5 and Fig. 7).
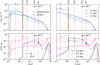 |
Fig. A.1 Solid surface density of pebbles and planetesimals (top) in a disc with [Fe/H] = 0.0 and the median C/O ratio for α = 10−3 (left) and α = 10−4 (right) as function of time. The bottom panels depict the Stokes numbers of the pebbles as well as the mid-plane dust-to-gas ratio. |
Appendix B Water content
We show in Fig. B.1 the water content of the solids in the protoplanetary disc at 140 K, so just outside of the water ice line at the beginning of our simulations. We show the water mass fraction at the beginning of our simulations, as this gives the best understanding how the C/O ratio (see table 3)changes the water ice fraction. As time progresses, pebbles move inwards and release their water content into the gas phase. However, the outward-diffusing water vapour can condense again and increase the water ice fraction at the ice line. This process - as discussed in the main paper - depends on the water ice fraction itself.
The water ice fraction depends clearly on the C/O ratio, but also on how the C/O ratio is manipulated. In our work, the water ice fraction is calculated by first distributing the elements into all carbon and oxygen bearing species, before the leftover oxygen is used to produce water. For low C/O ratios, where the carbon abundance is reduce, only the oxygen that is stored in CO and CO2 is released to form water. However, the majority of carbon is actually contained in CH4 and refractory carbon grains that harbour no oxygen. By reducing the carbon abundance for an overall low C/O ratio, only an tiny amount of oxygen is release, resulting in an increase of the water ice mass fraction by only 7%. Reciprocally, the high C/O ratio then only results in a reducing of the water mass fraction by a similarly small amount.
On the other hand, if the C/O ratio is manipulated by increasing the oxygen fraction, a larger change in the water content can be achieved. This is caused by the fact that the total dust mass stays constant (constant dust-to-gas ratio) and an increase in oxygen results in a decrease of all other elements. This releases additional oxygen due to the less abundant Mg2SiO4 and MgSiO3 - in addition to the less abundance CO and CO2 - to form water. Consequently, the water ice fraction is increased by nearly 25%, if the C/O ratio changes from 0.44 to 0.19. Reciprocally, an increase of the C/O ratio to 0.69 results in a decrease of the water fraction by nearly 20%.
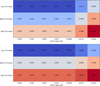 |
Fig. B.1 Water mass fraction in the solids at 140 K - so just outside the water ice line - at the start of our simulations. The top plot depicts the water ice fraction when the C/O ratio is changed by varying the carbon value, while the bottom plot shows the C/O ratio values if the oxygen abundances is varied. |
References
- Adibekyan, V. Z., Santos, N. C., Sousa, S. G., et al. 2012, A&A, 543, A89 [NASA ADS] [CrossRef] [EDP Sciences] [Google Scholar]
- Adibekyan, V., Dorn, C., Sousa, S. G., et al. 2021, Science, 374, 330 [NASA ADS] [CrossRef] [Google Scholar]
- Andama, G., Mah, J., & Bitsch, B. 2024, A&A, 683, A118 [NASA ADS] [CrossRef] [EDP Sciences] [Google Scholar]
- Asplund, M., Grevesse, N., Sauval, A. J., & Scott, P. 2009, ARAA, 47, 481 [NASA ADS] [CrossRef] [Google Scholar]
- Ataiee, S., Baruteau, C., Alibert, Y., & Benz, W. 2018, A&A, 615, A110 [NASA ADS] [CrossRef] [EDP Sciences] [Google Scholar]
- Bae, J., Isella, A., Zhu, Z., et al. 2023, ASP Conf. Ser., 534, 423 [NASA ADS] [Google Scholar]
- Batygin, K., & Morbidelli, A. 2023, Nat. Astron., 7, 330 [NASA ADS] [CrossRef] [Google Scholar]
- Bergner, J. B., Sturm, J. A., Piacentino, E. L., et al. 2024, ApJ, 975, 166 [NASA ADS] [CrossRef] [Google Scholar]
- Birnstiel, T., Klahr, H., & Ercolano, B. 2012, A&A, 539, A148 [NASA ADS] [CrossRef] [EDP Sciences] [Google Scholar]
- Bitsch, B., & Battistini, C. 2020, A&A, 633, A10 [NASA ADS] [CrossRef] [EDP Sciences] [Google Scholar]
- Bitsch, B., & Izidoro, A. 2023, A&A, 674, A178 [NASA ADS] [CrossRef] [EDP Sciences] [Google Scholar]
- Bitsch, B., & Izidoro, A. 2024, A&A, 692, A246 [NASA ADS] [CrossRef] [EDP Sciences] [Google Scholar]
- Bitsch, B., & Johansen, A. 2016, A&A, 590, A101 [NASA ADS] [CrossRef] [EDP Sciences] [Google Scholar]
- Bitsch, B., & Mah, J. 2023, A&A, 679, A11 [NASA ADS] [CrossRef] [EDP Sciences] [Google Scholar]
- Bitsch, B., Morbidelli, A., Johansen, A., et al. 2018, A&A, 612, A30 [NASA ADS] [CrossRef] [EDP Sciences] [Google Scholar]
- Boley, K. M., Christiansen, J. L., Zink, J., et al. 2024, AJ, 168, 128 [Google Scholar]
- Brauer, F., Dullemond, C., & Henning, T. 2008, A&A, 480, 859 [NASA ADS] [CrossRef] [EDP Sciences] [Google Scholar]
- Brewer, J. M., Wang, S., Fischer, D. A., & Foreman-Mackey, D. 2018, ApJ, 867, L3 [NASA ADS] [CrossRef] [Google Scholar]
- Buchhave, L. A., Latham, D. W., Johansen, A., et al. 2012, Nature, 486, 375 [NASA ADS] [Google Scholar]
- Buchhave, L. A., Bizzarro, M., Latham, D. W., et al. 2014, Nature, 509, 593 [Google Scholar]
- Buder, S., Asplund, M., Duong, L., et al. 2018, MNRAS, 478, 4513 [Google Scholar]
- Buder, S., Sharma, S., Kos, J., et al. 2021, MNRAS, 506, 150 [NASA ADS] [CrossRef] [Google Scholar]
- Burbidge, E. M., Burbidge, G. R., Fowler, W. A., & Hoyle, F. 1957, Rev. Mod. Phys., 29, 547 [NASA ADS] [CrossRef] [Google Scholar]
- Burke, D. J., & Brown, W. A. 2010, Phys. Chem. Chem. Phys., 12, 5947 [NASA ADS] [CrossRef] [Google Scholar]
- Cabral, N., Guilbert-Lepoutre, A., Bitsch, B., Lagarde, N., & Diakite, S. 2023, A&A, 673, A117 [NASA ADS] [CrossRef] [EDP Sciences] [Google Scholar]
- Carrera, D., Johansen, A., & Davies, M. B. 2015, A&A, 579, A43 [NASA ADS] [CrossRef] [EDP Sciences] [Google Scholar]
- Carrera, D., Gorti, U., Johansen, A., & Davies, M. B. 2017, ApJ, 839, 16 [Google Scholar]
- de Jong, R. S., Agertz, O., Berbel, A. A., et al. 2019, The Messenger, 175, 3 [NASA ADS] [Google Scholar]
- Delgado Mena, E., Adibekyan, V., Santos, N. C., et al. 2021, A&A, 655, A99 [NASA ADS] [CrossRef] [EDP Sciences] [Google Scholar]
- Drążkowska, J., & Alibert, Y. 2017, A&A, 608, A92 [Google Scholar]
- Drążkowska, J., Bitsch, B., Lambrechts, M., et al. 2023, ASP Conf. Ser., 534, 717 [NASA ADS] [Google Scholar]
- Fischer, D. A., & Valenti, J. 2005, ApJ, 622, 1102 [NASA ADS] [CrossRef] [Google Scholar]
- Fressin, F., Torres, G., Charbonneau, D., et al. 2013, ApJ, 766, 81 [NASA ADS] [CrossRef] [Google Scholar]
- Gail, H.-P., & Trieloff, M. 2017, A&A, 606, A16 [NASA ADS] [CrossRef] [EDP Sciences] [Google Scholar]
- Gibb, E. L., Whittet, D. C. B., Boogert, A. C. A., & Tielens, A. G. G. M. 2004, ApJS, 151, 35 [NASA ADS] [CrossRef] [Google Scholar]
- Gillon, M., Triaud, A. H. M. J., Demory, B.-O., et al. 2017, Nature, 542, 456 [NASA ADS] [CrossRef] [Google Scholar]
- Guerra-Alvarado, O. M., van der Marel, N., Williams, J. P., et al. 2025, A&A, 696, A232 [NASA ADS] [CrossRef] [EDP Sciences] [Google Scholar]
- Gundlach, B., & Blum, J. 2015, ApJ, 798, 34 [Google Scholar]
- Hayashi, C. 1981, Prog. Theor. Phys. Suppl., 70, 35 [Google Scholar]
- Hsieh, C.-H., Arce, H. G., Maureira, M. J., et al. 2024, ApJ, 973, 138 [NASA ADS] [CrossRef] [Google Scholar]
- Hsieh, C.-H., Arce, H. G., Maureira, M. J., et al. 2025, A&A, 700, A235 [NASA ADS] [CrossRef] [EDP Sciences] [Google Scholar]
- Izidoro, A., Ogihara, M., Raymond, S. N., et al. 2017, MNRAS, 470, 1750 [Google Scholar]
- Izidoro, A., Bitsch, B., Raymond, S. N., et al. 2021a, A&A, 650, A152 [EDP Sciences] [Google Scholar]
- Izidoro, A., Dasgupta, R., Raymond, S. N., et al. 2021b, Nat. Astron., 6, 357 [Google Scholar]
- Johansen, A., & Youdin, A. 2007, ApJ, 662, 627 [Google Scholar]
- Johansen, A., Oishi, J. S., Mac Low, M. M., et al. 2007, Nature, 448, 1022 [NASA ADS] [CrossRef] [Google Scholar]
- Johansen, A., Mac Low, M. M., Lacerda, P., & Bizzarro, M. 2015, Sci. Adv., 1, 1500109 [CrossRef] [Google Scholar]
- Johnson, J. A., Aller, K. M., Howard, A. W., & Crepp, J. R. 2010, PASP, 122, 905 [Google Scholar]
- Lambrechts, M., Johansen, A., & Morbidelli, A. 2014, A&A, 572, A35 [NASA ADS] [CrossRef] [EDP Sciences] [Google Scholar]
- Lambrechts, M., Morbidelli, A., Jacobson, S. A., et al. 2019, A&A, 627, A83 [NASA ADS] [CrossRef] [EDP Sciences] [Google Scholar]
- Lenz, C. T., Klahr, H., & Birnstiel, T. 2019, ApJ, 874, 36 [NASA ADS] [CrossRef] [Google Scholar]
- Li, R., & Youdin, A. N. 2021, ApJ, 919, 107 [NASA ADS] [CrossRef] [Google Scholar]
- Lodders, K. 2003, ApJ, 591, 1220 [Google Scholar]
- Madhusudhan, N., Amin, M. A., & Kennedy, G. M. 2014, ApJ, 794, L12 [Google Scholar]
- Mathis, J. S., Rumpl, W., & Nordsieck, K. H. 1977, ApJ, 217, 425 [Google Scholar]
- Mayor, M., & Queloz, D. 1995, Nature, 378, 355 [Google Scholar]
- Millholland, S. C., & Winn, J. N. 2021, ApJ, 920, L34 [NASA ADS] [CrossRef] [Google Scholar]
- Mills, S. M., Fabrycky, D. C., Migaszewski, C., et al. 2016, Nature, 533, 509 [Google Scholar]
- Morbidelli, A. 2020, A&A, 638, A1 [Google Scholar]
- Mulders, G. D., Pascucci, I., Apai, D., & Ciesla, F. J. 2018, AJ, 156, 24 [Google Scholar]
- Müller, J., Savvidou, S., & Bitsch, B. 2021, A&A, 650, A185 [Google Scholar]
- Mumma, M. J., & Charnley, S. B. 2011, ARA&A, 49, 471 [NASA ADS] [CrossRef] [Google Scholar]
- Musiolik, G., & Wurm, G. 2019, ApJ, 873, 58 [NASA ADS] [CrossRef] [Google Scholar]
- Narang, M., Manoj, P., Furlan, E., et al. 2018, AJ, 156, 221 [Google Scholar]
- Ohashi, N., Tobin, J. J., Jørgensen, J. K., et al. 2023, ApJ, 951, 8 [NASA ADS] [CrossRef] [Google Scholar]
- Petigura, E. A., Marcy, G. W., Winn, J. N., et al. 2018, AJ, 155, 89 [Google Scholar]
- Pinilla, P., Lenz, C. T., & Stammler, S. M. 2021, A&A, 645, A70 [NASA ADS] [CrossRef] [EDP Sciences] [Google Scholar]
- Sándor, Z., Guilera, O. M., Regály, Z., & Lyra, W. 2024, A&A, 686, A78 [NASA ADS] [CrossRef] [EDP Sciences] [Google Scholar]
- Santos, N. C., Israelia, G., & Mayor, M. 2004, A&A, 415, 1153 [NASA ADS] [CrossRef] [EDP Sciences] [Google Scholar]
- Schneider, A. D., & Bitsch, B. 2021, A&A, 654, A71 [Google Scholar]
- Shakura, N. I., & Sunyaev, R. A. 1973, A&A, 24, 337 [NASA ADS] [Google Scholar]
- Shibata, S., & Izidoro, A. 2025, ApJ, 979, L23 [Google Scholar]
- Simon, J., Armitage, P. J., Li, R., & Youdin, A. 2016, ApJ, 822, 55 [NASA ADS] [CrossRef] [Google Scholar]
- Voelkel, O., Klahr, H., Mordasini, C., & Emsenhuber, A. 2022, A&A, 666, A90 [NASA ADS] [CrossRef] [EDP Sciences] [Google Scholar]
- Weidenschilling, S. J. 1977, MNRAS, 180, 57 [Google Scholar]
- Weidenschilling, S. J. 1977, Ap&SS, 51, 153 [Google Scholar]
- Weiss, L. M., Isaacson, H. T., Marcy, G. W., et al. 2018a, AJ, 156, 254 [Google Scholar]
- Weiss, L. M., Marcy, G. W., Petigura, E. A., et al. 2018b, AJ, 155, 48 [Google Scholar]
- Zubko, V., Dwek, E., & Arendt, R. G. 2004, ApJS, 152, 211 [NASA ADS] [CrossRef] [Google Scholar]
All Tables
All Figures
|
Fig. 1 Solid surface density of pebbles and planetesimals (top) in a disc with [Fe/H] = −0.4 and the median C/O ratio for α = 10−3 (left) and α = 10−4 (right) as a function of time. The bottom panels depict the Stokes numbers of the pebbles as well as the mid-plane dust-to-gas ratio. Initially, the particles are micrometre sized, with Stokes numbers below 10−4 within ~100 AU. |
| In the text | |
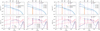 |
Fig. 2 Same as Fig. 1, but for the low C/O ratio (left) and the high C/O ratio (right). |
| In the text | |
|
Fig. 3 Pebble and planetesimal mass evolution for discs with different [Fe/H] values (left to right) and different viscosities (top to bottom). The different line styles correspond to different C/O ratios, which influence the disc’s water content and consequently planetesimal formation. |
| In the text | |
|
Fig. 4 Same as Fig. 3, but for even lower dust-to-gas ratios, where the limit of no planetesimal formation is reached, depending on the initial C/O ratio and initial dust-to-gas ratio. |
| In the text | |
|
Fig. 5 Planetesimal mass (in Earth masses) formed in discs with different initial dust-to-gas ratios as well as different C/O ratios. The change of the C/O ratio is achieved by changing the carbon grain fraction. The left panel depicts simulations with high viscosity, while the right panel shows simulations with low viscosity. |
| In the text | |
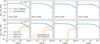 |
Fig. 6 Same as Fig. 4, but for discs where the C/O ratio is varied by changing the oxygen abundance. |
| In the text | |
 |
Fig. 7 Same as Fig. 5, but for discs where the C/O ratio is varied by changing the oxygen abundance. |
| In the text | |
|
Fig. A.1 Solid surface density of pebbles and planetesimals (top) in a disc with [Fe/H] = 0.0 and the median C/O ratio for α = 10−3 (left) and α = 10−4 (right) as function of time. The bottom panels depict the Stokes numbers of the pebbles as well as the mid-plane dust-to-gas ratio. |
| In the text | |
|
Fig. B.1 Water mass fraction in the solids at 140 K - so just outside the water ice line - at the start of our simulations. The top plot depicts the water ice fraction when the C/O ratio is changed by varying the carbon value, while the bottom plot shows the C/O ratio values if the oxygen abundances is varied. |
| In the text | |
Current usage metrics show cumulative count of Article Views (full-text article views including HTML views, PDF and ePub downloads, according to the available data) and Abstracts Views on Vision4Press platform.
Data correspond to usage on the plateform after 2015. The current usage metrics is available 48-96 hours after online publication and is updated daily on week days.
Initial download of the metrics may take a while.