Fig. 1
Download original image
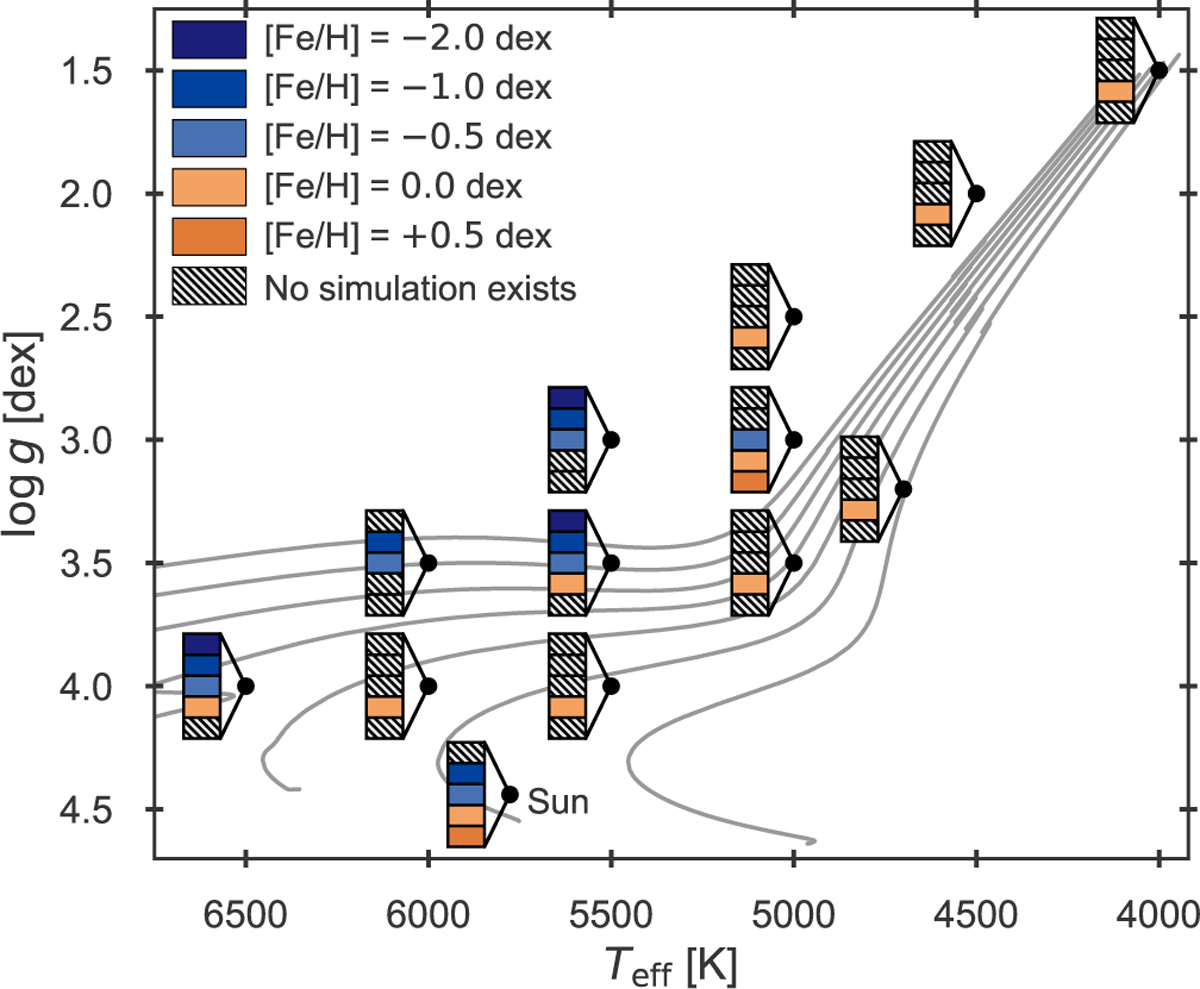
Kiel diagram displaying the simulation suite from Rodríguez Díaz et al. (2022). The available simulations are plotted for their associated metallicity in vertical stacks. The target (Teff, log g) position for each cluster is indicated by the connected black point. Note that the actual temperature of the relaxed simulations differs slightly from the target value. A sample of solar metallicity stellar evolution tracks with masses ranging from 0.8–2.0 M⊙ have been overplotted to guide the eye.
Current usage metrics show cumulative count of Article Views (full-text article views including HTML views, PDF and ePub downloads, according to the available data) and Abstracts Views on Vision4Press platform.
Data correspond to usage on the plateform after 2015. The current usage metrics is available 48-96 hours after online publication and is updated daily on week days.
Initial download of the metrics may take a while.