Fig. 2
Download original image
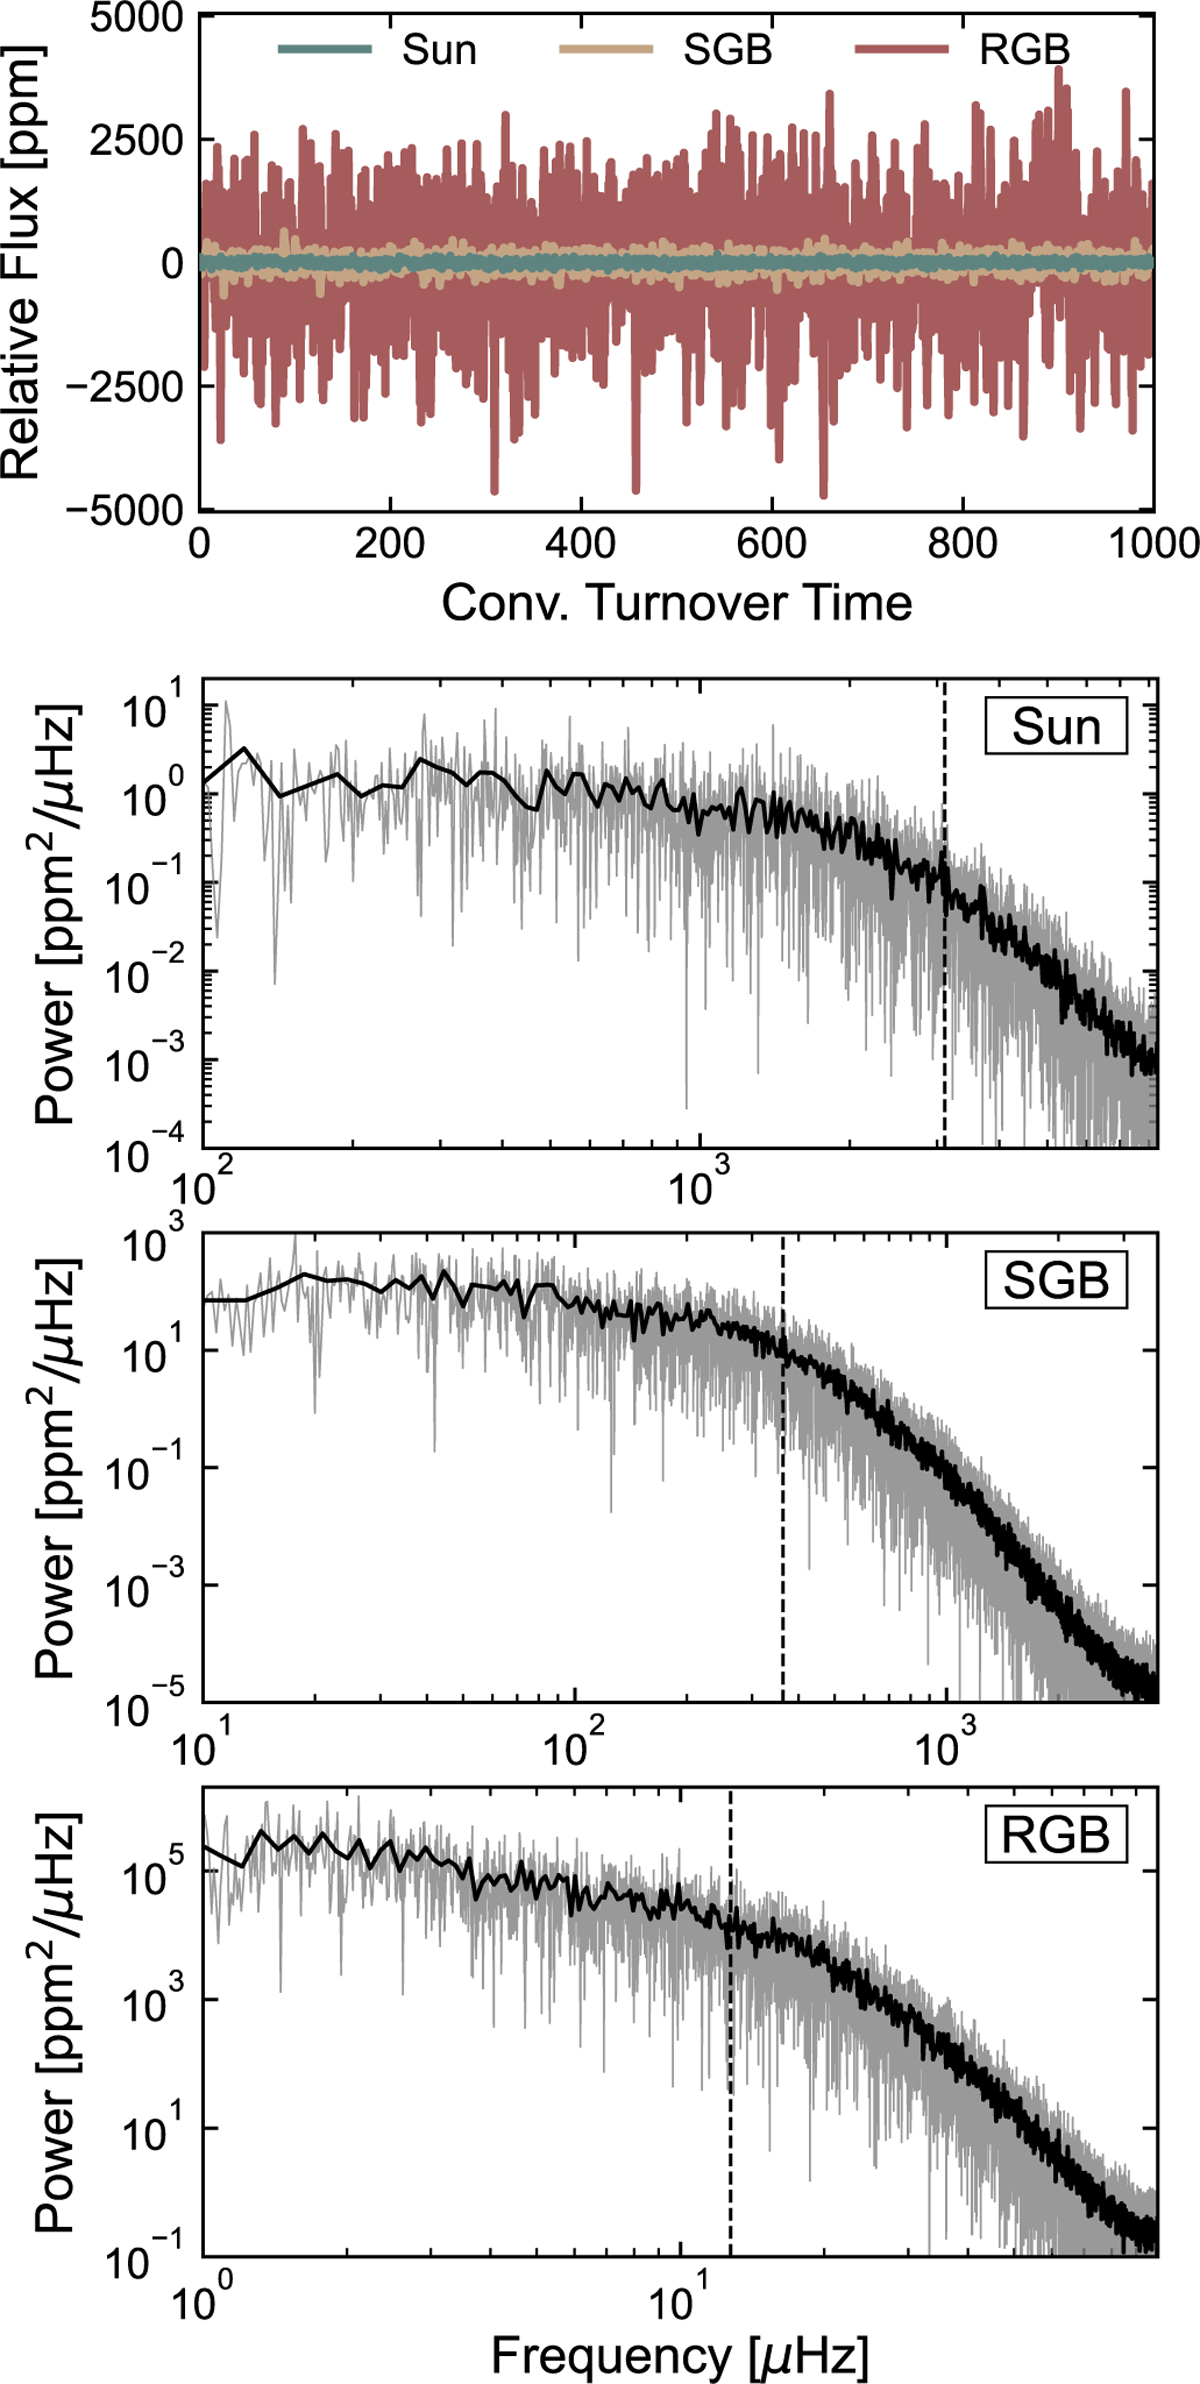
Time series and PDS of three simulations from Rodríguez Díaz et al. (2022), as a reformatted version of their Fig. 3. The time series are plotted as a function of convective turnover times and coloured as indicated by the legend. For each PDS, the raw spectrum is shown in grey with a binned version overplotted in black. The vertical dashed lines indicate the values of νmax ≃ 3094, 363, 12.7 μHz for the solar, SGB, and RGB simulations, respectively.
Current usage metrics show cumulative count of Article Views (full-text article views including HTML views, PDF and ePub downloads, according to the available data) and Abstracts Views on Vision4Press platform.
Data correspond to usage on the plateform after 2015. The current usage metrics is available 48-96 hours after online publication and is updated daily on week days.
Initial download of the metrics may take a while.