Fig. 3
Download original image
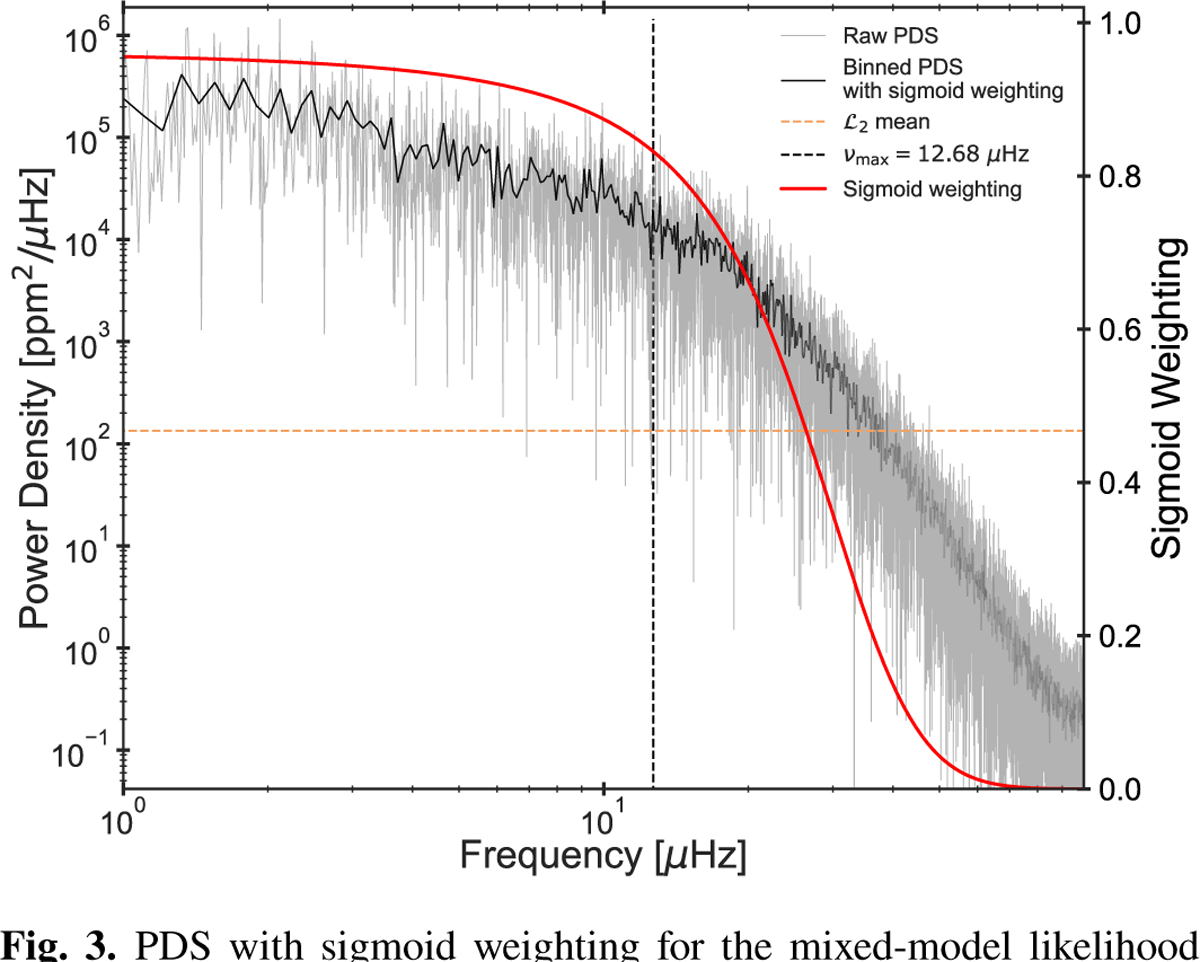
PDS with sigmoid weighting for the mixed-model likelihood approach for a RGB simulation. The raw spectrum is shown in grey with a binned version overplotted in black. The opacity of the binned PDS is set by the value of the sigmoid weight, indicated by the red profile gradually decreasing from 1 towards 0, as is indicated by the right-hand axis. The mean of the constant χ2 likelihood, L2, is indicated by the horizontal dashed orange line. The νmax of the simulation is indicated by the vertical dashed black line.
Current usage metrics show cumulative count of Article Views (full-text article views including HTML views, PDF and ePub downloads, according to the available data) and Abstracts Views on Vision4Press platform.
Data correspond to usage on the plateform after 2015. The current usage metrics is available 48-96 hours after online publication and is updated daily on week days.
Initial download of the metrics may take a while.