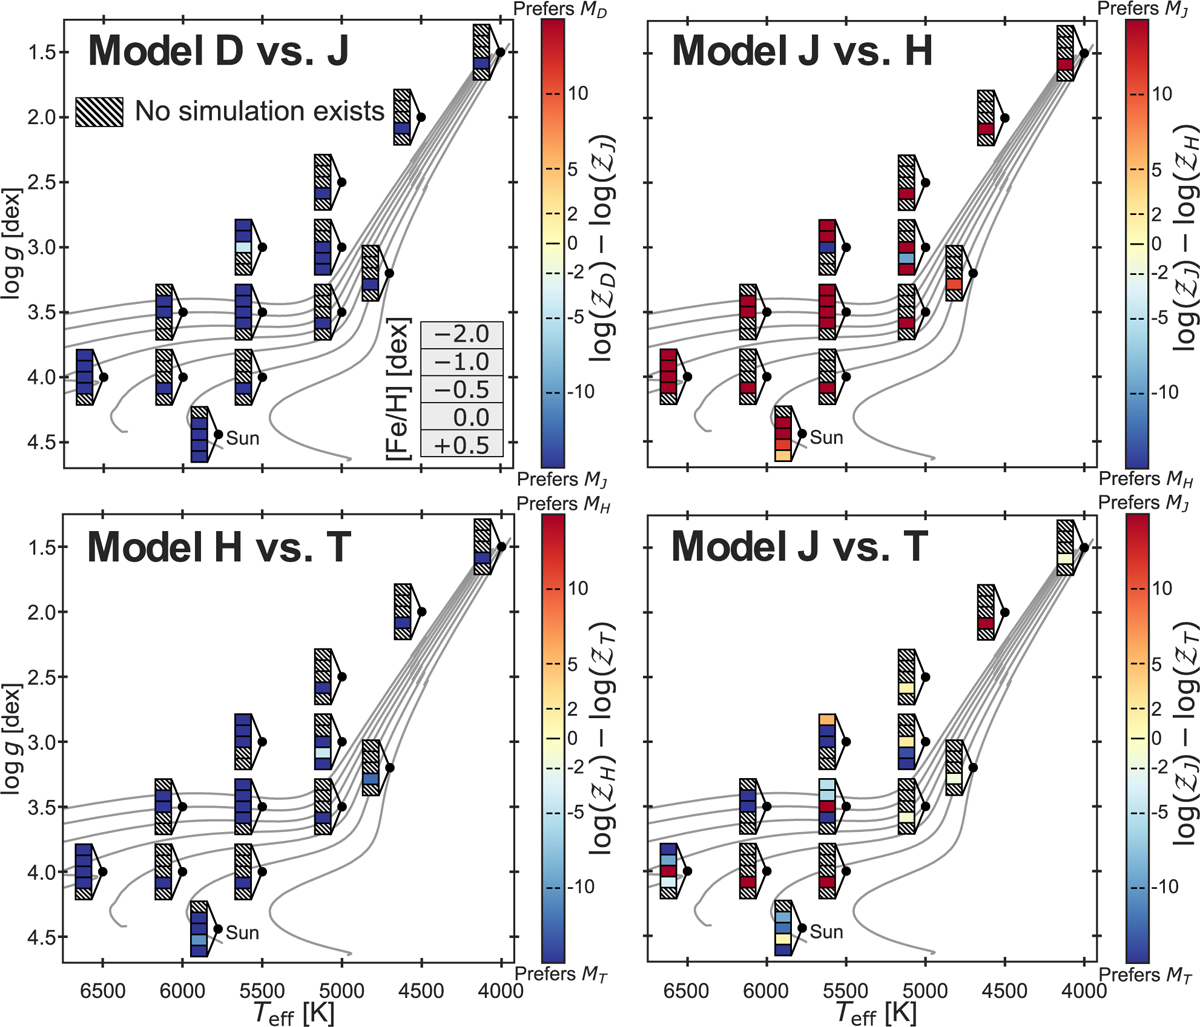
Fig. 4
Download original image
Evidence ratios for the specified model comparisons in increasing complexity. The format of the vertical stacks follow the metallicity convention introduced in Fig. 1, but are now coloured according to the evidence ratios, as is indicated by the colour bar. The Jeffreys scale for model comparison (Jeffreys 1961) is indicated on the colour bar, where beyond |dlog(Z)| ≳ 10 we have overwhelming preference for one model over the other. On the contrary, when |d log(Z)| ≲ 2, no significant preference for either model over the other is found. The levels where |dlog(Z)| ≃ 2 and 5 indicate significant and decisive preference, respectively.
Current usage metrics show cumulative count of Article Views (full-text article views including HTML views, PDF and ePub downloads, according to the available data) and Abstracts Views on Vision4Press platform.
Data correspond to usage on the plateform after 2015. The current usage metrics is available 48-96 hours after online publication and is updated daily on week days.
Initial download of the metrics may take a while.