Fig. 5
Download original image
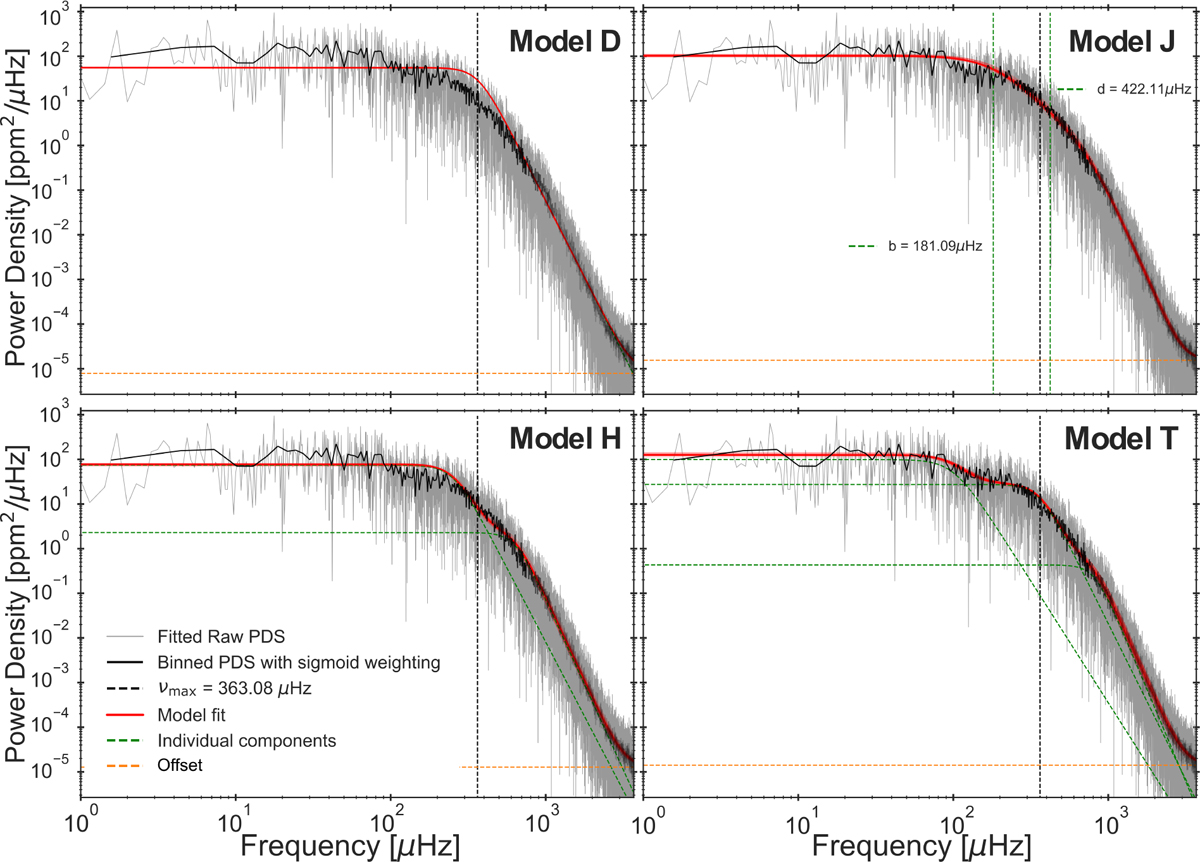
Fits of models D, J, H, and T for a SGB simulation with Teff = 5500 K, log g = 3.5 dex, and [Fe/H] = 0.0 dex. The models were fitted to the unbinned PDS shown in grey, but for clarity a binned version is overplotted, indicating the sigmoid weighting as in Fig. 3. The model is plotted in red using the median of the obtained posteriors for each fit parameter. Additionally, 50 randomly drawn samples from the posteriors were used to repeatedly plot the model alongside, as an indicator of the scatter. For models H and T, the individual components are plotted as dashed green profiles. For model J, the values of the two characteristic frequencies are instead shown as vertical dashed green lines. The value of νmax is indicated by the vertical dashed black line and the offset (as the power of the last points of the simulation PDS) by the horizontal dashed orange line.
Current usage metrics show cumulative count of Article Views (full-text article views including HTML views, PDF and ePub downloads, according to the available data) and Abstracts Views on Vision4Press platform.
Data correspond to usage on the plateform after 2015. The current usage metrics is available 48-96 hours after online publication and is updated daily on week days.
Initial download of the metrics may take a while.