Fig. 6
Download original image
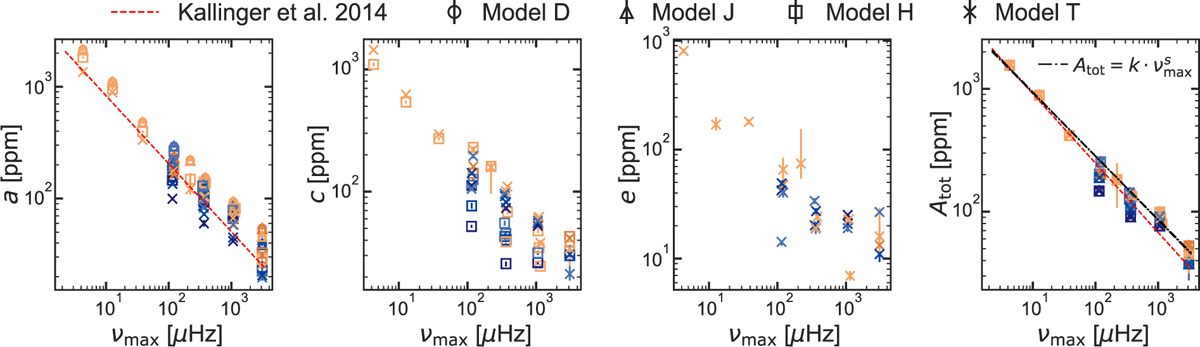
Granulation amplitudes, normalised by ξi as explained in Sect. 2.2, obtained as the median of the posterior with uncertainties as the 16th and 84th percentiles (often too small to be seen). The colours indicate metallicity following the convention in Fig. 1. The different symbols indicate the various background models. The panels show the amplitudes, a, c, and e, plotted for the associated models. The last panel shows the total granulation amplitude, Atot. In the panels for which direct comparisons to the relations derived in Kallinger et al. (2014) can be made, they are plotted as dashed red profiles. Three power-law fits are shown as the dash-dotted black profiles for the total granulation amplitudes, which completely overlap.
Current usage metrics show cumulative count of Article Views (full-text article views including HTML views, PDF and ePub downloads, according to the available data) and Abstracts Views on Vision4Press platform.
Data correspond to usage on the plateform after 2015. The current usage metrics is available 48-96 hours after online publication and is updated daily on week days.
Initial download of the metrics may take a while.