Fig. 8
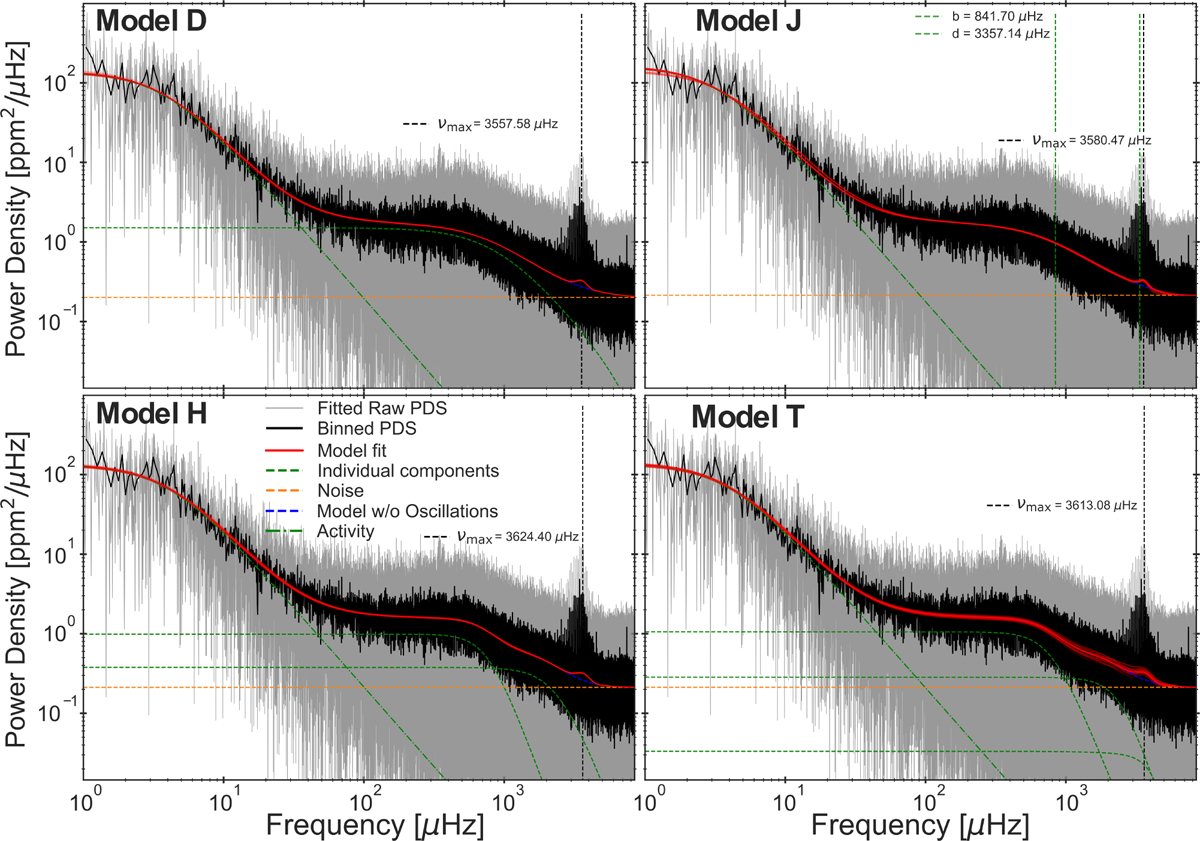
Download original image
Fits of models D, J, H, and T to Doris. The models are fitted to the unbinned PDS shown in grey, but for clarity, a binned version is overplotted. The model is plotted in red using the median of the obtained posteriors for each fit parameter. Additionally, 50 randomly drawn samples from the posteriors are plotted to indicate the scatter. For models D, H, and T, the individual components are plotted as dashed green profiles. For model J, the values of the two characteristic frequencies are shown as vertical dashed green lines. The fitted value of νmax is given and indicated by the vertical dashed black line, while the noise is shown by the horizontal dashed orange line. The activity component is the dash-dotted green line. The fitted model without the influence of the oscillation excess in plotted as the dashed blue profile, visible underneath the oscillation excess.
Current usage metrics show cumulative count of Article Views (full-text article views including HTML views, PDF and ePub downloads, according to the available data) and Abstracts Views on Vision4Press platform.
Data correspond to usage on the plateform after 2015. The current usage metrics is available 48-96 hours after online publication and is updated daily on week days.
Initial download of the metrics may take a while.