Fig. 1.
Download original image
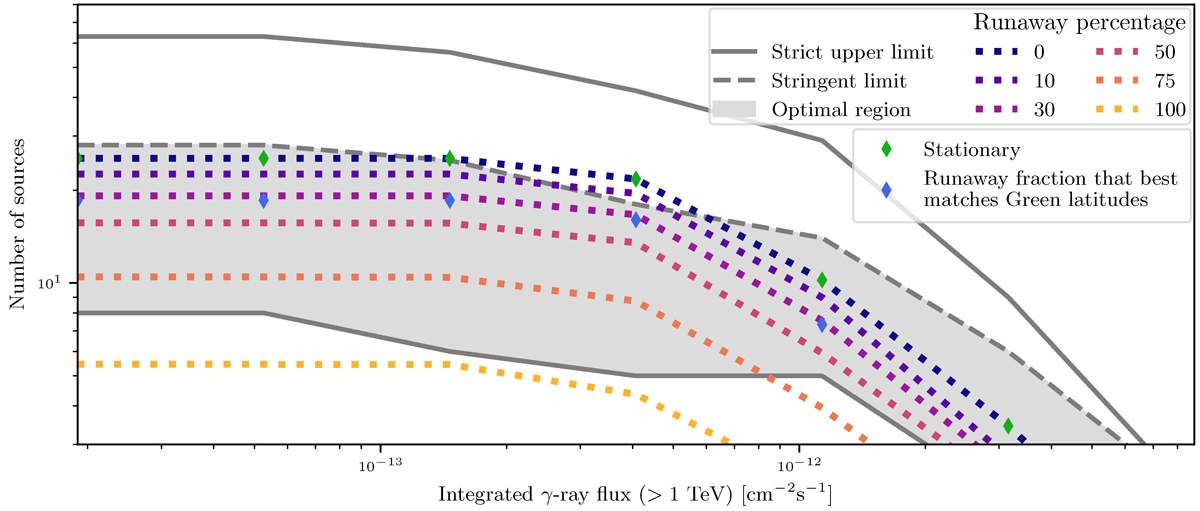
Distribution of the number of simulated SNR sources as a function of the integrated gamma-ray flux above 1 TeV observable in the HGPS. The grey region shows the ideal region for the simulations: between the identified SNRs and the sources associated with SNRs. The dotted coloured lines are the simulated populations assuming different percentage of runaway massive stars progenitors of the CC SNRs. The diamonds indicate the stationary (matching 0% runaways) and the fraction of runaways that best fit the latitudes in the Green catalogue.
Current usage metrics show cumulative count of Article Views (full-text article views including HTML views, PDF and ePub downloads, according to the available data) and Abstracts Views on Vision4Press platform.
Data correspond to usage on the plateform after 2015. The current usage metrics is available 48-96 hours after online publication and is updated daily on week days.
Initial download of the metrics may take a while.