| Issue |
A&A
Volume 701, September 2025
|
|
|---|---|---|
| Article Number | L4 | |
| Number of page(s) | 6 | |
| Section | Letters to the Editor | |
| DOI | https://doi.org/10.1051/0004-6361/202555665 | |
| Published online | 04 September 2025 | |
Letter to the Editor
Runaway stars and the Galactic supernova remnant landscape: Non-thermal emission and observational evidence
1
Universität Potsdam, Institut für Physik und Astronomie, Campus Golm, Haus 28, Karl-Liebknecht-Str. 24/25, 14476 Potsdam-Golm, Germany
2
Institute of Space Sciences (ICE, CSIC), Campus UAB, Carrer de Can Magrans s/n, 08193 Barcelona, Spain
⋆ Corresponding author: This email address is being protected from spambots. You need JavaScript enabled to view it.
Received:
26
May
2025
Accepted:
14
August
2025
Abstract
Context. A significant fraction (∼30%) of massive stars in our Galaxy are moving supersonically through the interstellar medium, which strongly governs their location at the time they end their lives and, for example die as a supernova and give birth to a supernova remnant (SNR). These dead stellar environments accelerate particles, emitting by non-thermal mechanisms up to the tera-electronvolt range, and they are considered a major contributor to the very-high-energy band of the local cosmic-ray spectrum.
Aims. This study investigates the effect of the runaway motion of supernova progenitors on the spatial distribution of SNRs in the Milky Way and how this influences the deduced properties of the population.
Methods. We constructed Galactic populations of SNRs with Monte Carlo simulations, taking into account the bulk motion and the evolution history of their progenitor stars once ejected from their parent clusters. The gamma-ray domain emission of each population was then calculated, to be compared with the High Energy Stereoscopic System (H.E.S.S.) Galactic Plane Survey.
Results. We find that including the runaway motion of supernova progenitors strongly modifies the detectability of the simulated emission of their remnants in the very-high-energy band. In particular, our best fit model using a Reid Milky Way model for core-collapse supernova progenitors requires 33% of massive runaway stars, which is close to the known fraction of runaway high-mass stars, to be in accordance with the H.E.S.S. Galactic Plane Survey data.
Conclusions. Our results show that the runaway nature of supernova progenitors must be taken into account in the study of the Galactic population of SNRs within the H.E.S.S. Galactic Plane Survey and the forthcoming Galactic Plane Survey of the Cherenkov Telescope Array Observatory, as it is a governing factor of the detectability of non-thermal emission of their subsequent SNRs.
Key words: acceleration of particles / astroparticle physics / stars: massive / ISM: supernova remnants
© The Authors 2025
 Open Access article, published by EDP Sciences, under the terms of the Creative Commons Attribution License (https://creativecommons.org/licenses/by/4.0), which permits unrestricted use, distribution, and reproduction in any medium, provided the original work is properly cited.
This article is published in open access under the Subscribe to Open model. This email address is being protected from spambots. You need JavaScript enabled to view it. to support open access publication.
1. Introduction
A fraction of massive stars are moving supersonically through their ambient medium (Blaauw 1961; Carretero-Castrillo et al. 2023). The fraction spans from a few percent to 50% (Kobulnicky & Chick 2022) but recent studies converge to ∼30%. This movement comes mainly from the ejection of stars from their parent clusters due to gravitational swing; however, there are other mechanisms for this, such as ejection from multiple systems (Hoogerwerf et al. 2000; Gvaramadze & Gualandris 2011; Bromley et al. 2009). Such motion does not prevent stellar evolution, and while running over parsec-scale distances, the stars keep on undergoing profound changes in their inner core that are reflected in the bow shock circumstellar nebulae (Weaver et al. 1977; Gull & Sofia 1979; Wilkin 1996) and lead to a final supernova explosion (Woosley & Weaver 1986). Consequently, a significant proportion of core-collapse (CC) supernova remnants (SNRs), originating from such runaway stars, are displaced with respect to their progenitor’s birthplace and might explain the existence of high-Galactic-latitude remnants (Katsuda et al. 2018).
There is evidence that SNRs accelerate particles; however, it is unknown whether they are the sources of all Galactic cosmic rays. This is a long-standing open problem in astroparticle physics. The standard paradigm is that they accelerate particles via diffusive shock acceleration. The accelerated protons and electrons interact with the interstellar medium to produce gamma rays in the very-high-energy domain, predominantly via (i) pion decay from proton-proton interactions (hadronic) and (ii) inverse Compton scattering of electrons on soft photons (leptonic). Galactic population studies have been performed, comparing simulated populations of SNRs in the tera-electronvolt range by their gamma-ray emission with tera-electronvolt measurements. These optimisations do not yield unique results due to degeneracies in the parameter space. So far, these works have assumed that the progenitors of supernovae were in situ objects (Batzofin et al. 2024).
Supernova remnants have been observed in many wavelengths from radio to gamma rays, and this information is gathered in the Green catalogue1 (Green 2019, 2022, 2025). The catalogue documents all known Galactic SNRs and was last updated in October 2024. At the time of writing, there are 310 SNRs in the catalogue, most of which have been detected and identified by radio instruments. The catalogue provides positional information such as the objects’ Galactic latitudes. In addition, Ranasinghe & Leahy (2022) published distances for 215 SNRs. The questions therefore relate to how the runaway nature of supernova progenitors influences the SNR population of the Milky Way, and how this modifies the tera-electronvolt detectability and the reconstructed non-thermal emission properties of the SNR population.
This paper includes the runaway nature of stars as supernova progenitors to the distribution of SNRs. We investigate its effect on the spatial distribution, confront the simulations with the H.E.S.S. data from the Galactic Plane Survey (HGPS) (H.E.S.S. Collaboration 2018) and the Green catalogue for SNRs (Green 2025) and derive the emission properties in the tera-electronvolt range of a Galactic population model. In Section 2 we describe our runaway progenitor model, in Section 3 we present and discuss our results, and in Section 4 we draw our conclusions.
2. Method
We constructed CC and thermonuclear pre-supernova population models following the Reid et al. (2019) distribution based on evolving massive stars forming in the Galactic plane and the Steiman-Cameron et al. (2010) distribution following the [CII] lines of the interstellar medium, respectively. These progenitors are potentially dynamically ejected from the plane. The distribution of the subset of runaway stars as a function of their bulk velocity is given by dN(v⋆)∝e−v⋆/vmax, with vmax = 150 km s−1 (Bromley et al. 2009). Each star is assigned two random angles (azimuthal and polar) for the direction of the motion, assumed to be a straight segment of size, v⋆tSN, where tSN is the lifetime of the star. Their initial mass, given by the initial mass function (Kroupa 2001), governs their evolution (Ekström et al. 2012). We refer the reader interested in the details on the distances travelled by the stellar population to Appendix A. The emission of each SNR was estimated based on particle acceleration (Cristofari et al. 2013; Ptuskin & Zirakashvili 2003, 2005) and reacceleration (Cristofari & Blasi 2019). The gamma-ray emission was calculated using the NAIMA code (Zabalza 2015), in particular, the pion decay model (Kafexhiu et al. 2014) and the inverse Compton model (Khangulyan et al. 2014). More details of the population model can be seen in Appendix B. The gamma-ray luminosity, size, and position of each SNR was used to determine its detectability in the HGPS, following the method of Steppa & Egberts (2020). When comparing the number of detectable simulated SNRs with the HGPS we used lower, stringent, and strict limits. The lower limit (8) is the firmly detected SNRs, the stringent limit (28) is the lower limit plus the composite objects (8) plus the unidentified sources associated (by position) with a SNR (12), and the strict limit (63) is the stringent limit plus the rest of the unidentified sources (35). The three main parameters explored in our model are the spectral index of accelerated particles (α), the efficiency of particle acceleration (η), and the electron-to-proton ratio (Kep). Using a static source distribution based on Steiman-Cameron et al. (2010), we found that the parameter combination with the most populations within our stringent limits was α = 4.2, Kep = 10−5, and η = 0.09.
3. Results
3.1. A Galactic population of runaway massive stars induces fewer supernova remnants that are detectable by the HGPS
Including a subset of runaway stars in the Galactic population model of Batzofin et al. (2024), has the following effect: an increase in the percentage of runaway CC SNR progenitors naturally decreases the number of simulated SNRs that would be detectable in the HGPS. This is in part because an equivalent fraction of the gamma-ray bright SNRs move out of the region covered by H.E.S.S. observations (|b|≤3°), and in part because the interstellar medium is less dense further from the plane, which causes the SNRs to be less luminous and larger in size, making them harder to detect. We investigated the impact of changing the runaway percentage using the initial parameters that we identified previously as the best match to the HGPS data. We set the thermonuclear runaway percentage to 0% for this part. In Fig. 1, the log N–log S distribution of detectable SNRs is shown (including both thermonuclear and CC SNRs). The change in detectable SNRs as the CC progenitor runaway percentage changes is shown by the dotted coloured lines. Changing from no runaways to all the CC SNRs coming from runaway progenitors, the number of HGPS-detectable sources for the given parameter set drops from 25.37 to 5.45, on average for the 100 populations. In comparison with the limits obtained by the HGPS data (shaded grey region), having no runaway stars, the number of detectable SNRs is at or above the stringent upper limit, while having all progenitors being runaway stars, this number is at or below the lower limit. This is our first result, i.e. runaway massive stars affect the detectability of HGPS SNRs.
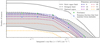 |
Fig. 1. Distribution of the number of simulated SNR sources as a function of the integrated gamma-ray flux above 1 TeV observable in the HGPS. The grey region shows the ideal region for the simulations: between the identified SNRs and the sources associated with SNRs. The dotted coloured lines are the simulated populations assuming different percentage of runaway massive stars progenitors of the CC SNRs. The diamonds indicate the stationary (matching 0% runaways) and the fraction of runaways that best fit the latitudes in the Green catalogue. |
3.2. The current observed population of CC SNRs of the Green catalogue is in agreement with the known proportion of runaway massive stars
We constrained the proportion of runaway massive stars in the Milky Way, which is known from the literature to be ∼30% of the stellar population in the high-mass regime. We fitted the percentage of runaways required to best match the latitude distribution of the SNRs in the Green catalogue, which is independent of the HGPS campaign. As the latitude distribution of an incomplete catalogue crucially depends on the distance of the detected sources (for simple geometrical reasons), we selected only those SNRs from the Green catalogue whose distances were known (Ranasinghe & Leahy 2022) and chose from our simulated populations sources that matched the distance distribution of the Green catalogue sources, mitigating the bias. A two-sample Kolmogorov-Smirnov test (Hodges 1958) was used to determine the similarity of the latitudes between our simulated sources and the sources in the Green catalogue. For details of the fitting, see Appendix C. The best fit has a CC runaway percentage of 33% and a thermonuclear runaway percentage of 0.02%.
We investigated the latitude distributions of simulated SNRs with sources from the HGPS by varying the fraction of CC runaway progenitors from 0% to 100%. Again the thermonuclear runaway percentage was set to 0%. We categorised the HGPS sources into three groups based on their identification and used the two-sample Kolmogorov-Smirnov test to assess similarity. The categories follow our lower, stringent, and upper limits; their latitude distributions are shown in Fig. 2. We find that as the runaway percentage increases, so does the similarity between the distributions of the HGPS SNRs and the simulated SNRs. A challenge in the comparison of simulations and data is the asymmetry of the HGPS-detected sources with a shift to negative latitudes, which is not reproduced by simulations. A less pronounced effect is also visible in the latitude distribution of the Green-catalogue SNRs.
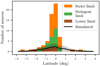 |
Fig. 2. Latitude distribution of the HGPS sources, split up into their source types and the simulated sources, with a runaway fraction of 100% for CC progenitors and 0% for thermonuclear progenitors, and the following parameter set: α = 4.15, Kep = 10−4.5, and η = 0.07. |
This result provides an insight into the progenitor distributions and potential selection effects within the Green catalogue by constraining the percentage of runaway massive stars to 33% in the Galactic population, in accordance with the literature.
3.3. Our proportion of runaway massive stars constrained from the Green catalogue latitude distribution produces a supernova population distribution in accordance with the observed HGPS log N–log S distribution
We calculated the log N–log S distribution that would be observable within the HGPS for a Galactic population of SNRs, accounting for the fact that a subset of the CC SNRs, previously constrained to 33%, originate from massive runaway stars. We explored the parameter space for this new source distribution using the work flow of Batzofin et al. (2024) and found that the parameter sets that have the highest number of populations in agreement with our stringent limits, while also including at least four sources with Emax > 10 TeV, include amongst others the same parameter set as in Batzofin et al. (2024) (α = 4.2, Kep = 10−5, η = 0.09, α = 4.15, Kep = 10−5, η = 0.05, and α = 4.2, Kep = 10−4.5, and η = 0.07). Notably, 100% of these populations are in agreement with the HGPS. As in our previous work, multiple parameter sets produce a large fraction of populations that align with the HGPS constraints. The log N–log S plot for the best-fit parameters, both for the run percentage that best matches the latitudes from the Green catalogue and for the case with no runaway SNRs, is shown in Fig. 1.
Using the extreme case of all CC SNRs originating from runaway progenitors as suggested by the HGPS latitude distribution, we found two sets of parameters within the formalism of Batzofin et al. (2024), with 100% of the populations residing within the stringent limit and having at least four SNRs with Emax > 10 TeV. In accordance with our first finding of Section 3.1 and Fig. 1, a 100% fraction of runaways requires a larger number of detectable SNRs, modifying the optimal parameter set with respect to the stationary case to favour brighter sources. The optimal parameter sets are: α = 4.15, Kep = 10−4.5, η = 0.07 and α = 4.05, Kep = 10−5, η = 0.03.
The latitude distribution of an example parameter set of α = 4.15, Kep = 10−4.5, η = 0.07 is shown in Fig. 2. Comparing the latitudes of the detectable simulated SNRs from these parameter sets to the latitudes of the sources in the HGPS, we obtained the following p-value ranges:  (SNRs),
  (SNRs and composites),
  (all associated with SNRs), and
  (including all unidentified sources). It is possible to match both the latitude distribution and the flux distribution of the HGPS sources when assuming the extreme case of all CC SNRs coming from runaway progenitors.
We conclude that the fraction of runaway massive stars, inferred from the latitude distribution of the Green catalogue, leads to a supernova population distribution that aligns with the observed HGPS log N–log S distribution. A larger fraction of runaways, indicated by the HGPS latitude distribution, requires a brighter SNR population; this can be achieved by increasing the electron fraction, having a harder spectral index, or increasing the acceleration efficiency.
4. Discussion and conclusion
We investigated the effects of the bulk motion of massive stars on the Galactic non-thermal emission observed by the HGPS. We highlight that a subset of moving massive stars in the Milky Way implies that fewer SNRs are able to be detected by the HGPS survey. Furthermore, we constrained this proportion of runaway high-mass stars with Monte-Carlo simulations that we tested against the current observed population of SNRs in the Green catalogue and found that the runaway percentage is about 33% for CC progenitors and about 0.02% for thermonuclear progenitors, which is in good agreement with the known proportion of runaway massive stars in the literature. Including this percentage of fast-moving supernova progenitors in the population synthesis of Batzofin et al. (2024) modifies the simulated log N–log S distribution of HGPS-detectable sources. We found optimised parameter sets for that simulated log N–log S distribution, which both include this runaway star percentage and produce a supernova population distribution whose emission is in accordance with the observed HGPS log N–log S distribution. Comparing our simulations with the latitude distribution of HGPS sources yields significantly different estimates, suggesting that all CC SNRs originate from runaway progenitors and also favouring different parameter sets that describe the population properties. Although the divergence of these results persists, it has to be noted that the pronounced asymmetry in the H.E.S.S. latitude distribution challenges the detailed description with a symmetrical model. Despite these challenges, we are able to exclude large portions of our parameter space, such as α ≥ 4.35 and Kep > 10−3. Our study concludes that including the bulk motion of massive stars, given its governing effect on the distribution of SNRs within the latitudes of the Milky Way, is an element that has to be taken into account when characterising the Galactic SNR population.
Beyond these conclusions, one may ask whether the factors governing the ejection of high-mass runaway stars might, in turn, influence our results. These factors include both the spatial distribution of massive star-forming regions within the Milky Way and the mechanisms responsible for stellar ejection from clusters containing massive stars (Hoogerwerf et al. 2000; Schoettler et al. 2019). The former arises from the star formation history of the Galaxy, while the latter involves detailed N-body dynamics that lead to the ejection of massive stars from their natal environments. In other words, the Galactic star formation rate, the initial mass function (Kroupa 2001), and the intrinsic physics of stellar clusters (Krause et al. 2020) drive local variations in the distribution of young massive stars – factors that are not incorporated into our current model. The effect of binary interactions on the stellar evolution (Marchant & Bodensteiner 2024) can be assumed to play a minor role for our purposes and is neglected. Additionally, the motion of stars can be expected to further influence the compression ratio of the SNR’s expanding shock front, particularly when interacting with the progenitor’s circumstellar medium, which will affect particle acceleration processes and the resulting non-thermal emission associated with these remnants (Meyer et al. 2023, 2024).
More observations, particularly of higher-latitude SNRs, would help to narrow down the expected number of SNRs forming from runaway progenitors. Future instruments, such as the Cherenkov Telescope Array Observatory (CTAO) (Abe et al. 2024) and the Large High Altitude Air Shower Observatory (LHAASO) (Liu et al. 2016), should greatly increase the number of detected SNRs, helping us to refine our population model further, understand the physics of massive star formation and the functioning of stellar ejection out of massive stellar clusters, and better constrain the runaway nature of CC progenitors and their effects on the properties of the Galactic SNR population.
Green D. A., 2024, ‘A Catalogue of Galactic SNRs (2024 October version)’, Cavendish Laboratory, Cambridge, United Kingdom (available at https://www.mrao.cam.ac.uk/surveys/snrs/).
Acknowledgments
The authors would like to give the referee a big thank-you, their suggestions and comments significantly improved the work. The authors are grateful for the computing time on the high-performance computer “Lise” at the NHR Center NHR@ZIB, jointly supported by the Federal Ministry of Education and Research and the state governments participating in the NHR (https://www.nhr-verein.de/unsere-partner). This work is funded by the Deutsche Forschungsgemeinschaft (DFG, German Research Foundation) with the grant 500120112 and supported by the grant PID2021-124581OB-I00 funded by MCIN/AEI/10.13039/501100011033 and 2021SGR00426 of the Generalitat de Catalunya. This work is also supported by the Spanish program Unidad de Excelencia María de Maeztu CEX2020-001058-M. This work is also supported by MCIN with funding from European Union NextGeneration EU (PRTR-C17.I1).
References
- Abe, S., Abhir, J., Abhishek, A., et al. 2024, JCAP, 2024, 081 [Google Scholar]
- Batzofin, R., Cristofari, P., Egberts, K., Steppa, C., & Meyer, D. M. A. 2024, A&A, 687, A279 [CrossRef] [EDP Sciences] [Google Scholar]
- Blaauw, A. 1961, Bull. Astron. Inst. Netherlands, 15, 265 [NASA ADS] [Google Scholar]
- Bromley, B. C., Kenyon, S. J., Brown, W. R., & Geller, M. J. 2009, ApJ, 706, 925 [Google Scholar]
- Carretero-Castrillo, M., Ribó, M., & Paredes, J. M. 2023, A&A, 679, A109 [NASA ADS] [CrossRef] [EDP Sciences] [Google Scholar]
- Chevalier, R. A. 1982, ApJ, 258, 790 [NASA ADS] [CrossRef] [Google Scholar]
- Cristofari, P., & Blasi, P. 2019, MNRAS, 489, 108 [NASA ADS] [CrossRef] [Google Scholar]
- Cristofari, P., Gabici, S., Casanova, S., Terrier, R., & Parizot, E. 2013, MNRAS, 434, 2748 [Google Scholar]
- Eggenberger, P., Meynet, G., Maeder, A., et al. 2008, Ap&SS, 316, 43 [Google Scholar]
- Ekström, S., Georgy, C., Eggenberger, P., et al. 2012, A&A, 537, A146 [Google Scholar]
- Georgy, C. 2010, Ph.D. Thesis, University of Geneva, Switzerland [Google Scholar]
- Green, D. A. 2019, JApA, 40, 36 [NASA ADS] [Google Scholar]
- Green, D. A. 2022, A Catalogue of Galactic Supernova Remnants (2022 December version), Cavendish Laboratory, Cambridge, United Kingdom, http://www.mrao.cam.ac.uk/surveys/snrs [Google Scholar]
- Green, D. A. 2025, JApA, 46, 14 [Google Scholar]
- Gull, T. R., & Sofia, S. 1979, ApJ, 230, 782 [CrossRef] [Google Scholar]
- Gvaramadze, V. V., & Gualandris, A. 2011, MNRAS, 410, 304 [CrossRef] [Google Scholar]
- H.E.S.S. Collaboration (Abdalla, H., et al.) 2018, A&A, 612, A1 [NASA ADS] [CrossRef] [EDP Sciences] [Google Scholar]
- Hodges, J. L. 1958, Arkiv för Matematik, 3, 469 [CrossRef] [Google Scholar]
- Hoogerwerf, R., de Bruijne, J. H. J., & de Zeeuw, P. T. 2000, ApJ, 544, L133 [NASA ADS] [CrossRef] [Google Scholar]
- Kafexhiu, E., Aharonian, F., Taylor, A. M., & Vila, G. S. 2014, Phys. Rev. D, 90, 123014 [Google Scholar]
- Katsuda, S., Takiwaki, T., Tominaga, N., Moriya, T. J., & Nakamura, K. 2018, ApJ, 863, 127 [Google Scholar]
- Khangulyan, D., Aharonian, F. A., & Kelner, S. R. 2014, ApJ, 783, 100 [Google Scholar]
- Kobulnicky, H. A., & Chick, W. T. 2022, AJ, 164, 86 [CrossRef] [Google Scholar]
- Krause, M. G. H., Offner, S. S. R., Charbonnel, C., et al. 2020, Space Sci. Rev., 216, 64 [CrossRef] [Google Scholar]
- Kroupa, P. 2001, MNRAS, 322, 231 [NASA ADS] [CrossRef] [Google Scholar]
- Liu, Y., Cao, Z., Chen, S., et al. 2016, ApJ, 826, 63 [NASA ADS] [CrossRef] [Google Scholar]
- Marchant, P., & Bodensteiner, J. 2024, ARA&A, 62, 21 [NASA ADS] [CrossRef] [Google Scholar]
- Meyer, D. M. A., Pohl, M., Petrov, M., & Egberts, K. 2023, MNRAS, 521, 5354 [NASA ADS] [CrossRef] [Google Scholar]
- Meyer, D. M. A., Velázquez, P. F., Pohl, M., et al. 2024, A&A, 687, A127 [NASA ADS] [CrossRef] [EDP Sciences] [Google Scholar]
- Ptuskin, V. S., & Zirakashvili, V. N. 2003, A&A, 403, 1 [NASA ADS] [CrossRef] [EDP Sciences] [Google Scholar]
- Ptuskin, V. S., & Zirakashvili, V. N. 2005, A&A, 429, 755 [NASA ADS] [CrossRef] [EDP Sciences] [Google Scholar]
- Ranasinghe, S., & Leahy, D. 2022, ApJ, 940, 63 [NASA ADS] [CrossRef] [Google Scholar]
- Reid, M. J., Menten, K. M., Brunthaler, A., et al. 2019, ApJ, 885, 131 [Google Scholar]
- Ruiter, A. J., Belczynski, K., & Fryer, C. 2009, ApJ, 699, 2026 [Google Scholar]
- Schoettler, C., Parker, R. J., Arnold, B., et al. 2019, MNRAS, 487, 4615 [CrossRef] [Google Scholar]
- Shibata, M., Katayose, Y., Huang, J., & Chen, D. 2010, ApJ, 716, 1076 [Google Scholar]
- Steiman-Cameron, T. Y., Wolfire, M., & Hollenbach, D. 2010, ApJ, 722, 1460 [NASA ADS] [CrossRef] [Google Scholar]
- Steppa, C., & Egberts, K. 2020, A&A, 643, A137 [NASA ADS] [CrossRef] [EDP Sciences] [Google Scholar]
- Truelove, J. K., & McKee, C. F. 1999, ApJS, 120, 299 [Google Scholar]
- Weaver, R., McCray, R., Castor, J., Shapiro, P., & Moore, R. 1977, ApJ, 218, 377 [Google Scholar]
- Wilkin, F. P. 1996, ApJ, 459, L31 [Google Scholar]
- Woosley, S. E., & Weaver, T. A. 1986, ARA&A, 24, 205 [NASA ADS] [CrossRef] [Google Scholar]
- Zabalza, V. 2015, Proceedings of the 34th International Cosmic Ray Conference (ICRC2015), 922 [Google Scholar]
- Zahn, J. P. 1992, A&A, 265, 115 [NASA ADS] [Google Scholar]
Appendix A: Distance travelled for runaway progenitors
The distance that a runaway progenitor travels is calculated using the velocity and lifetime of the progenitor.bulk velocity is given by dN(v⋆)∝e−v⋆/vmax, with vmax = 150 km s−1 (Bromley et al. 2009). The parameter needed for this calculation is the lifetime of the star tSN: For CC supernovae, we start by considering the high-mass regime of the initial mass function, i.e. the distribution mass function of massive stars when reaching the onset of their main-sequence in a given star-formation region (Kroupa 2001), to get a mass distribution for the CC SNR progenitor, see also the method in Batzofin et al. (2024). The relation between the zero-age main-sequence masses of high-mass stars and their lifetimes is estimated on the basis of tabulated evolution models interpolated from the GENEVA library2 (Eggenberger et al. 2008; Ekström et al. 2012). This code calculates one-dimensional stellar structures including internal convection, diffusion (Zahn 1992) and mass-loss physics (Georgy 2010). The final age, tSN, is estimated as the moment the inner core of massive stars triggers Si burning. Thermonuclear SNRs are much less likely to be formed from runaway stars (< 2%), however, they can travel for a much longer time through the interstellar medium, and consequently, finish their life further from the Galactic plane than higher-mass stars. In order to determine tSN for the thermonuclear supernova progenitors, we use the delay time before the explosion. The distribution of delay times derived from the basis of simulations is the power law f(t)∝100t−1, see Ruiter et al. (2009). The distance travelled by a star v⋆tSN is then obtained, see Fig. A.1.
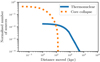 |
Fig. A.1. Normalised distribution of distances travelled by the progenitor star of supernova remnants in the Milky Way, for both thermonuclear (blue, solid line) and CC (orange, dotted line) progenitors. |
Appendix B: SNR population model
The SNR population model has three ingredients: the physics of the SNR, the spatial distribution, and the matter distribution. The matter distribution follows Shibata et al. (2010), which has an empirical model for the gas density of hydrogen (H1 and H2) as a function of galactocentric distance and height above or below the Galactic plane.
The source distribution starts with the the CC SNR distribution following Reid et al. (2019), which is based on massive stars with maser parallaxes and the thermonuclear SNR distribution following Steiman-Cameron et al. (2010), which is based on measurements of the interstellar medium ([CII] line). This stationary distribution is then altered by some of the SNRs being runaway and not remaining in the original position.
We assume that 32% of the SNRs are thermonuclear and 68% are CC. The thermonuclear SNRs have an explosion energy of 1051 erg and the mass of the ejecta is 1.4M⊙. For CC SNRs, we use the high-mass regime of the initial mass function to get the distribution of initial masses from which we estimate the ejecta mass and explosion energy of the SNR. The evolution of the SNRs is the same as in Batzofin et al. (2024). The dynamical evolution of the shock, the shock radius and velocity as a function of time, is computed in the same way as in Ptuskin & Zirakashvili (2003, 2005), Chevalier (1982), Truelove & McKee (1999), taking into account the density of interstellar matter at the location of the SNR. In addition the magnetic field amplification due to non-resonant streaming is taken into account. We assume that some fraction ξCR of the ram pressure is converted into cosmic ray protons at the shock; and that a fraction Kep of ξCR is converted into accelerated electrons. The gamma-ray emission is calculated from the spectrum of protons and electrons, assuming an electron-proton ratio and a spectral index.
The only changes in the population model from Batzofin et al. (2024) is in the distribution of SNRs. We now separate the distributions of the CC and thermonuclear SNRs and include runaway SNRs for both types of SNRs.
Appendix C: Fitting the runaway percentage using the SNRs in the Green catalogue
We restricted the maximum thermonuclear SNR runaway percentage to 2%, while allowing the CC SNR run percentage to vary between 0% and 100%. The simulated SNRs in each population are selected such that the distribution of the distances in the simulated population is matching to that of the SNRs in the Green catalogue. Using the two-sample Kolmogorov-Smirnov test we found that the simulated populations whose SNR latitudes most closely match those of the Green catalogue sources have a CC runaway percentage of 33% and a thermonuclear runaway percentage of 0.02%, the p-value for this selection is 0.37. Thus, we cannot reject the null hypothesis that the latitude distributions of the simulated and observed populations are statistically matching, suggesting that the selection process effectively minimises biases and that the simulated populations reasonably represent the observed distribution of SNRs. The initial positions of the SNRs naturally have an impact of the runaway percentage that best matches the Green data. We found that with different distributions as much as 50% CC progenitor runaways are required to best match the Green data. In Fig. C.1 the simulated latitudes are shown with the Green latitudes, taking into account the distance distribution, showing the similarities of the two distributions.
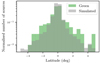 |
Fig. C.1. Histogram of the latitudes of Green SNRs and the simulated SNRs chosen to match the distance distribution of the Green catalogue, with a runaway fraction of 33% for CC progenitors and 0.02% for thermonuclear progenitors. |
All Figures
|
Fig. 1. Distribution of the number of simulated SNR sources as a function of the integrated gamma-ray flux above 1 TeV observable in the HGPS. The grey region shows the ideal region for the simulations: between the identified SNRs and the sources associated with SNRs. The dotted coloured lines are the simulated populations assuming different percentage of runaway massive stars progenitors of the CC SNRs. The diamonds indicate the stationary (matching 0% runaways) and the fraction of runaways that best fit the latitudes in the Green catalogue. |
| In the text | |
|
Fig. 2. Latitude distribution of the HGPS sources, split up into their source types and the simulated sources, with a runaway fraction of 100% for CC progenitors and 0% for thermonuclear progenitors, and the following parameter set: α = 4.15, Kep = 10−4.5, and η = 0.07. |
| In the text | |
|
Fig. A.1. Normalised distribution of distances travelled by the progenitor star of supernova remnants in the Milky Way, for both thermonuclear (blue, solid line) and CC (orange, dotted line) progenitors. |
| In the text | |
|
Fig. C.1. Histogram of the latitudes of Green SNRs and the simulated SNRs chosen to match the distance distribution of the Green catalogue, with a runaway fraction of 33% for CC progenitors and 0.02% for thermonuclear progenitors. |
| In the text | |
Current usage metrics show cumulative count of Article Views (full-text article views including HTML views, PDF and ePub downloads, according to the available data) and Abstracts Views on Vision4Press platform.
Data correspond to usage on the plateform after 2015. The current usage metrics is available 48-96 hours after online publication and is updated daily on week days.
Initial download of the metrics may take a while.