Fig. 1
Download original image
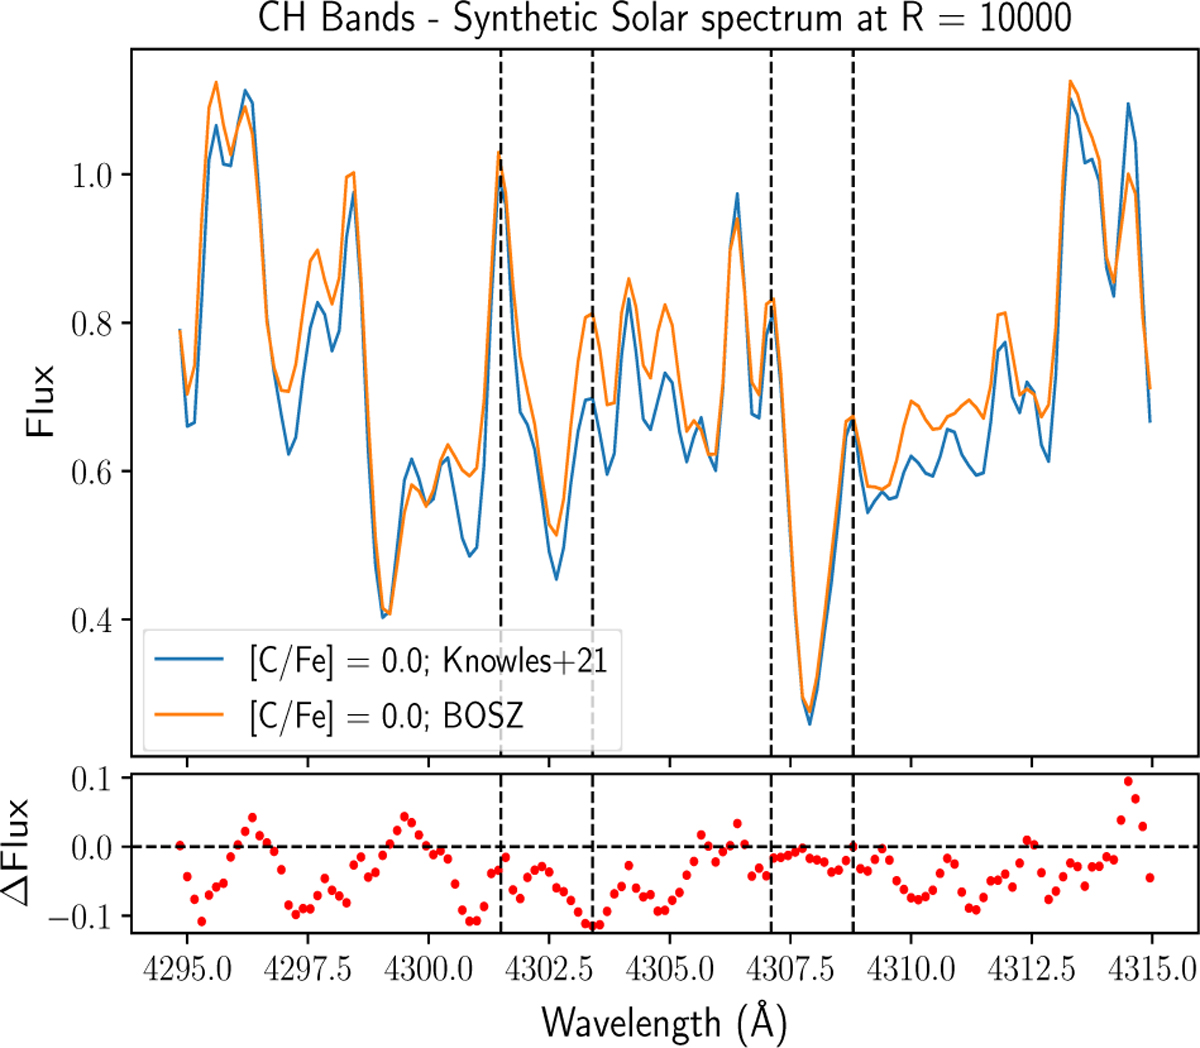
Synthetic solar spectrum in the CH band region around ~4300 Å at the X-shooter resolution (R = 10 000) from the two employed reference grids: the grid computed by Knowles et al. (2021, blue), and the updated BOSZ library (orange). The selected CH bands (see Table 1), where the [C/Fe] abundance is measured, are delimited by the dashed vertical black lines. The flux difference at each wavelength between the two synthetic solar spectra is shown in the bottom panel.
Current usage metrics show cumulative count of Article Views (full-text article views including HTML views, PDF and ePub downloads, according to the available data) and Abstracts Views on Vision4Press platform.
Data correspond to usage on the plateform after 2015. The current usage metrics is available 48-96 hours after online publication and is updated daily on week days.
Initial download of the metrics may take a while.