Open Access
Fig. 12
Download original image
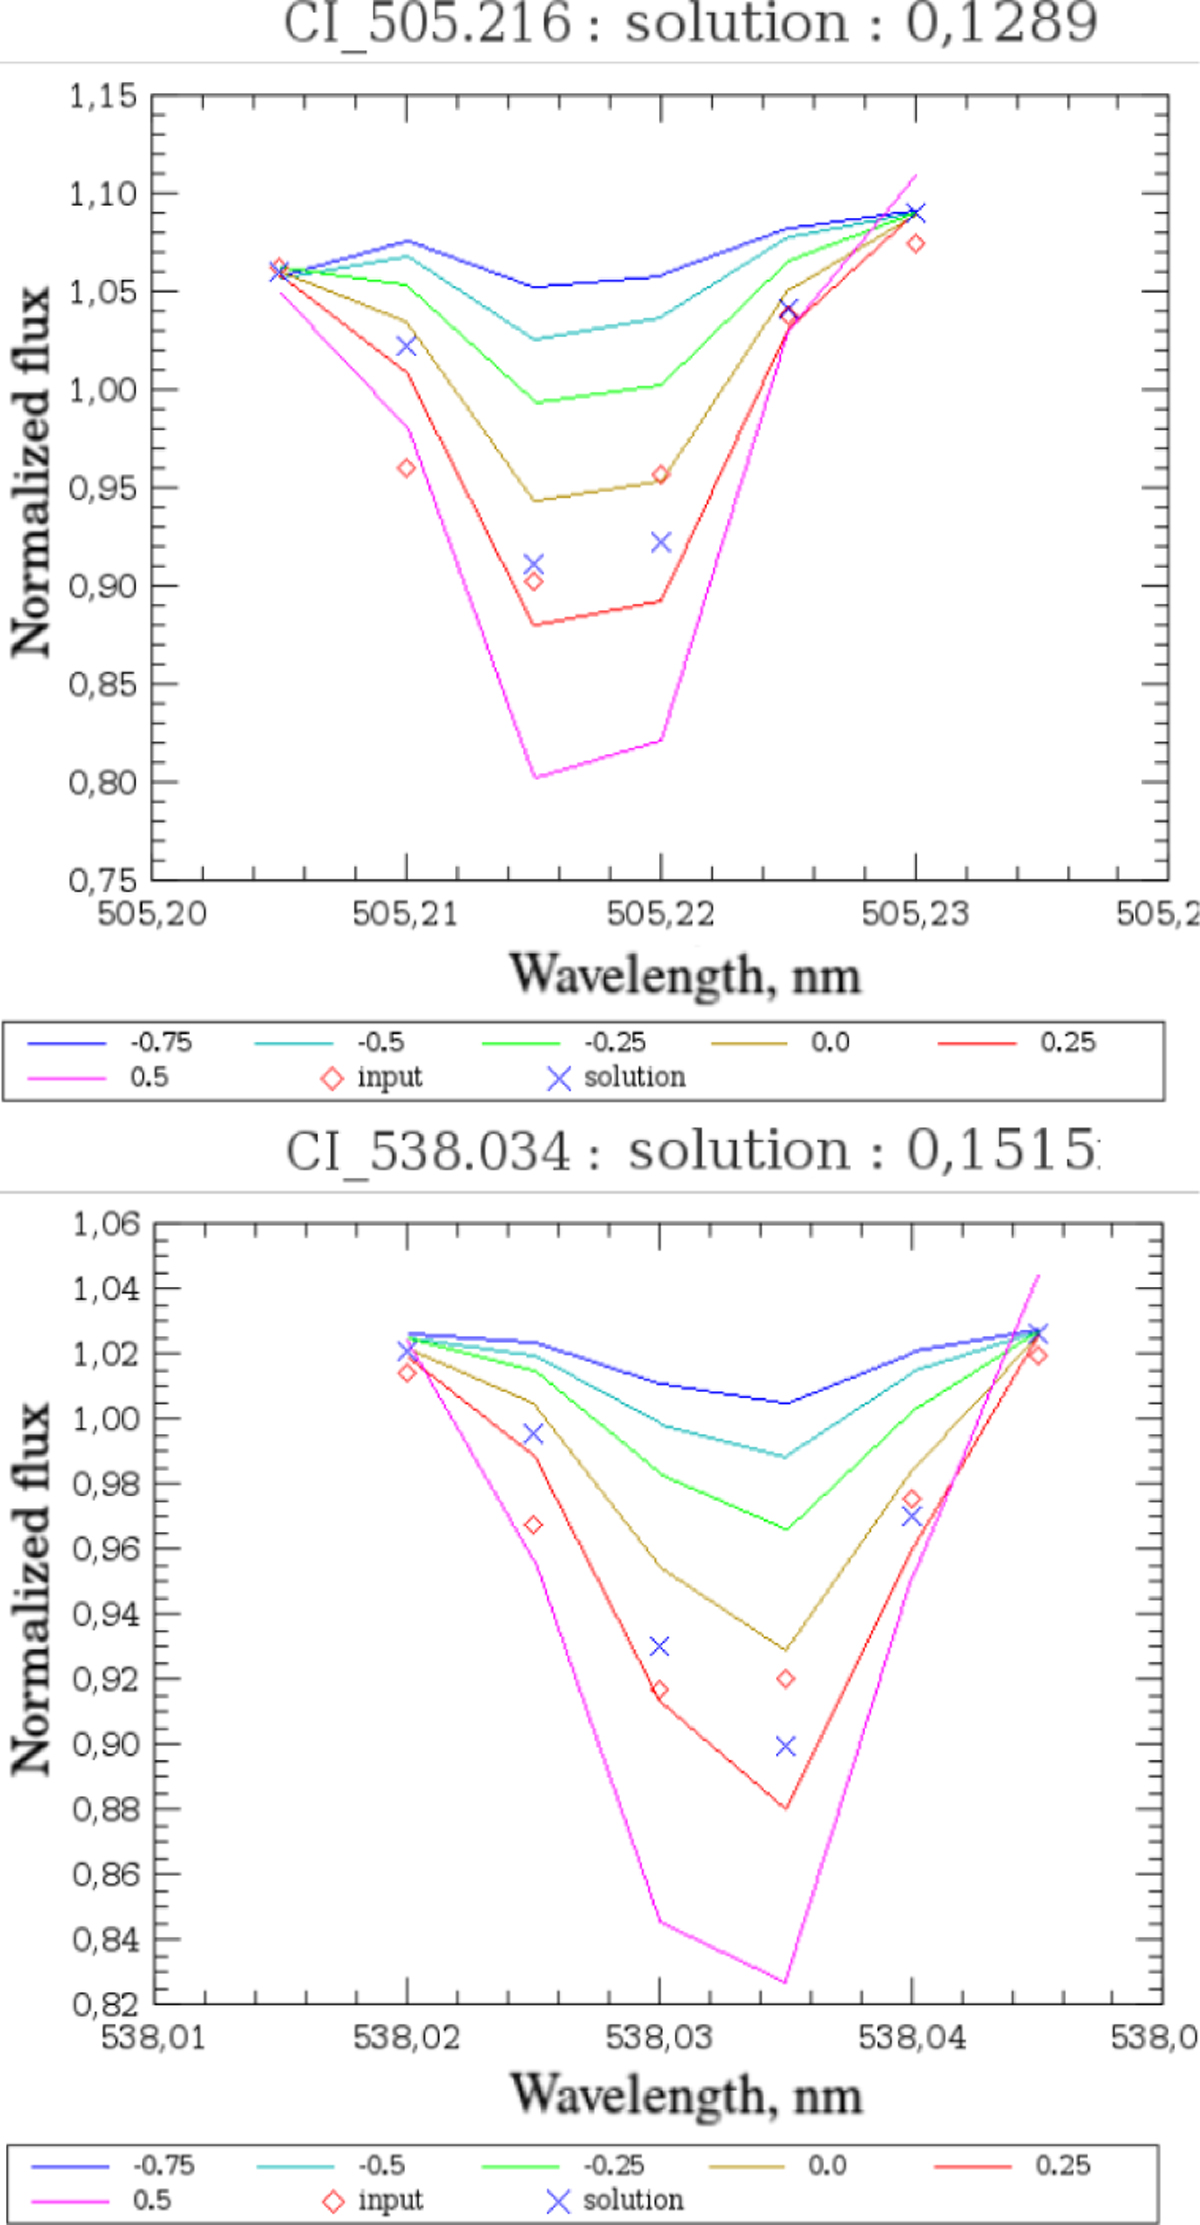
Same as Fig. 2, but for the most frequently used CI lines in the literature (5052.16, 5380.34 Å) in the observed solar spectrum at R = 110 000. The reference synthetic spectrum grid is taken from Knowles et al. (2021).
Current usage metrics show cumulative count of Article Views (full-text article views including HTML views, PDF and ePub downloads, according to the available data) and Abstracts Views on Vision4Press platform.
Data correspond to usage on the plateform after 2015. The current usage metrics is available 48-96 hours after online publication and is updated daily on week days.
Initial download of the metrics may take a while.