Fig. 3
Download original image
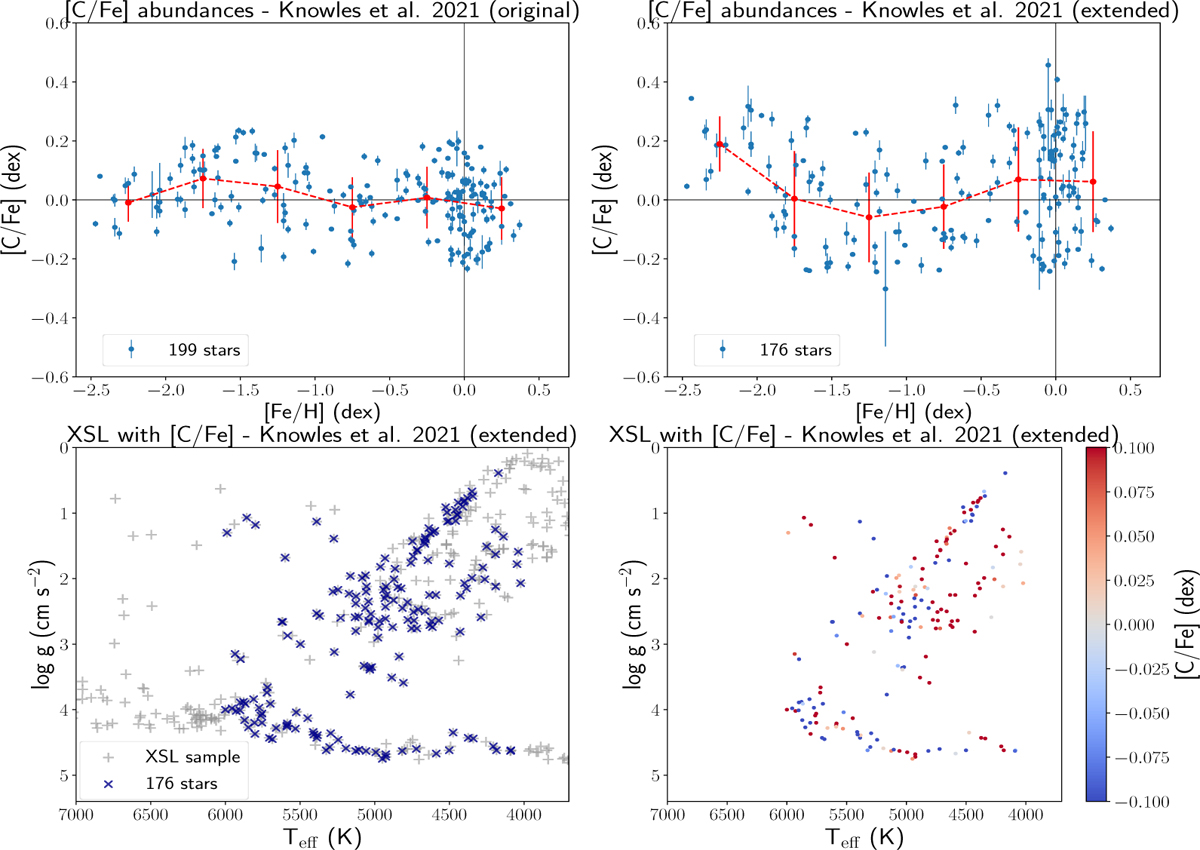
Top row: stellar abundance ratios [C/Fe] vs. [Fe/H] of the X-shooter catalogue after applying the optimal method, with the original synthetic grid from Knowles et al. (2021) (top left) and with the extended [C/Fe] dimension (top right), with the estimated internal uncertainties as vertical error bars. Each red point and error bar corresponds to the measured [C/Fe] average and scatter in metallicity bins of 0.5 dex. Bottom row: HR diagrams of the final X-shooter stellar sample with reliable [C/Fe] abundance measurements from the extended grid over the whole analysed X-shooter sample in this work (grey crosses, bottom left), and colour-coded by the carbon abundance estimate (grey crosses, bottom right).
Current usage metrics show cumulative count of Article Views (full-text article views including HTML views, PDF and ePub downloads, according to the available data) and Abstracts Views on Vision4Press platform.
Data correspond to usage on the plateform after 2015. The current usage metrics is available 48-96 hours after online publication and is updated daily on week days.
Initial download of the metrics may take a while.