Fig. 4
Download original image
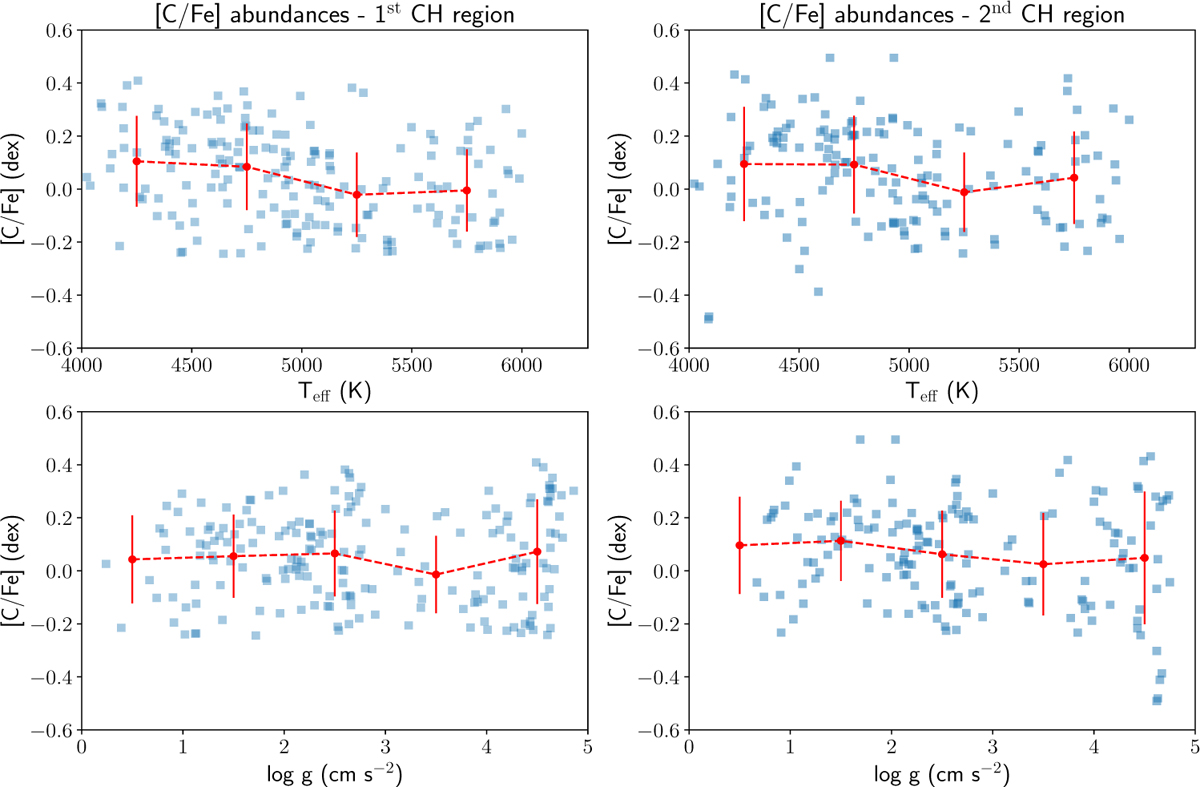
Derived [C/Fe] abundance ratio from each analysed CH band separately (left and right columns, shown in Table 1 ) as a function of the stellar effective temperature (top row) and surface gravity (bottom row). Each red point and error bar corresponds to the measured average and scatter in temperature and gravity bins of 500 Κ and log 1 cm s–2, respectively.
Current usage metrics show cumulative count of Article Views (full-text article views including HTML views, PDF and ePub downloads, according to the available data) and Abstracts Views on Vision4Press platform.
Data correspond to usage on the plateform after 2015. The current usage metrics is available 48-96 hours after online publication and is updated daily on week days.
Initial download of the metrics may take a while.