Fig. 5
Download original image
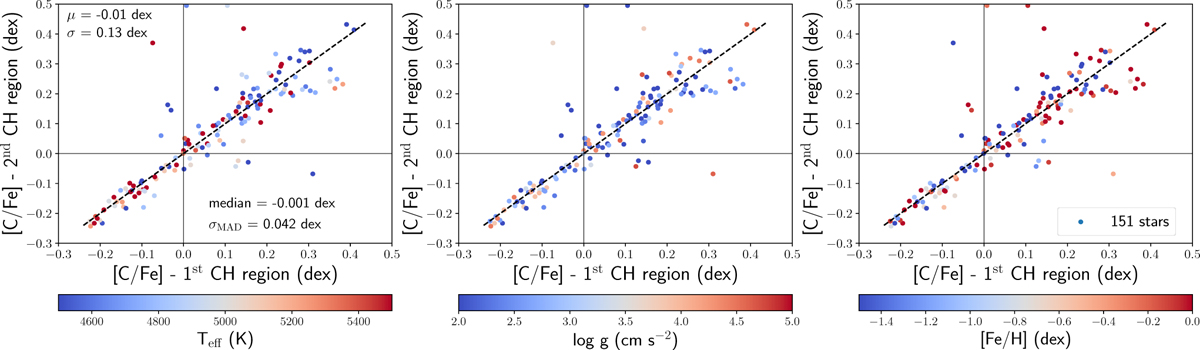
Comparison between the derived [C/Fe] abundances from the individual analysed CH bands, colour-coded according to the effective temperature (left), surface gravity (middle), and metallicity (right) of the star. The dashed black line reproduces the 1:1 relation. The mean (μ), standard deviation (σ), median, and robust standard deviation (i.e. ~1.48 times the median absolute deviation, MAD) of the offsets are indicated in the first panel.
Current usage metrics show cumulative count of Article Views (full-text article views including HTML views, PDF and ePub downloads, according to the available data) and Abstracts Views on Vision4Press platform.
Data correspond to usage on the plateform after 2015. The current usage metrics is available 48-96 hours after online publication and is updated daily on week days.
Initial download of the metrics may take a while.