Fig. 12
Download original image
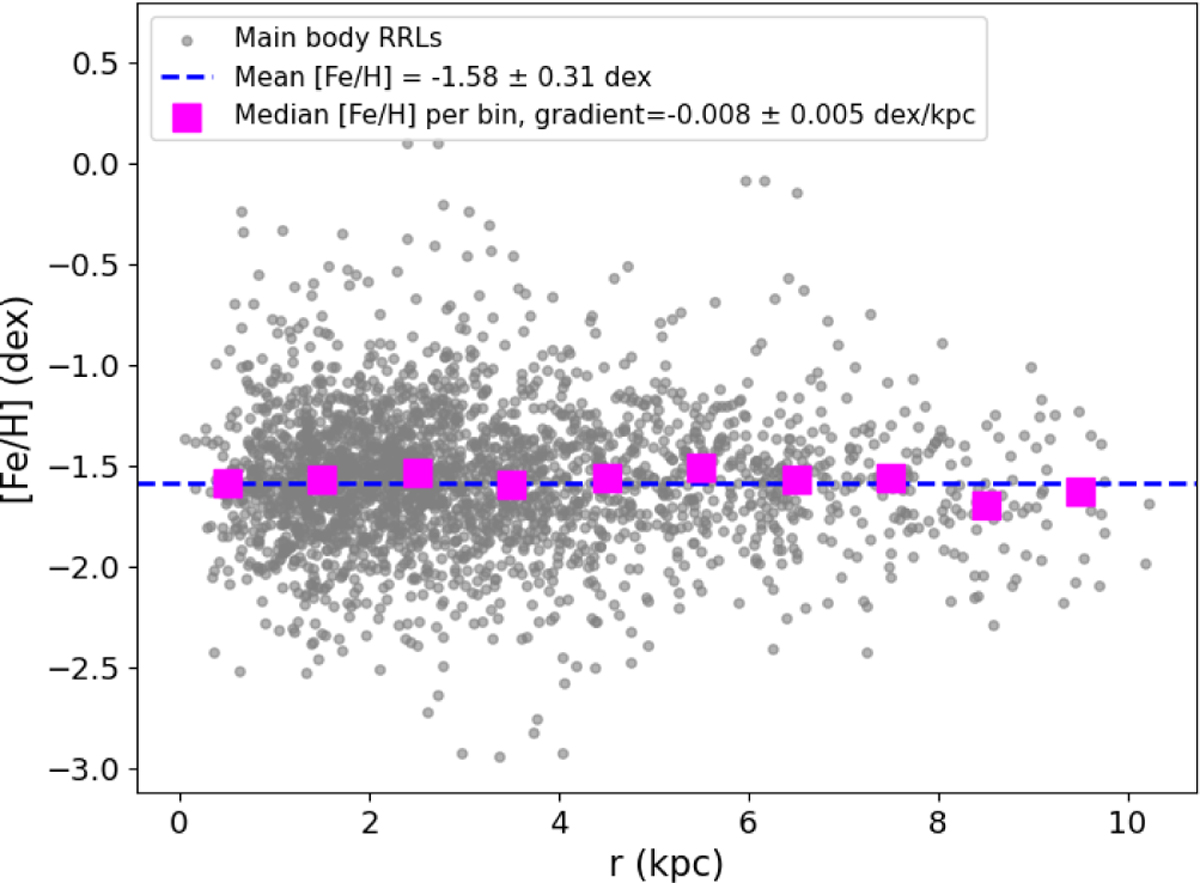
Metallicity distribution as a function of radial distance from the center of the Sgr core for RRLs in the RRLS-SGR-SELECTION sample belonging to the main body. The blue line represents the weighted mean metallicity of RRLs in the main body, while the magenta squares indicate the median metallicities calculated for each bin containing more than ten RRLs.
Current usage metrics show cumulative count of Article Views (full-text article views including HTML views, PDF and ePub downloads, according to the available data) and Abstracts Views on Vision4Press platform.
Data correspond to usage on the plateform after 2015. The current usage metrics is available 48-96 hours after online publication and is updated daily on week days.
Initial download of the metrics may take a while.