Fig. 6
Download original image
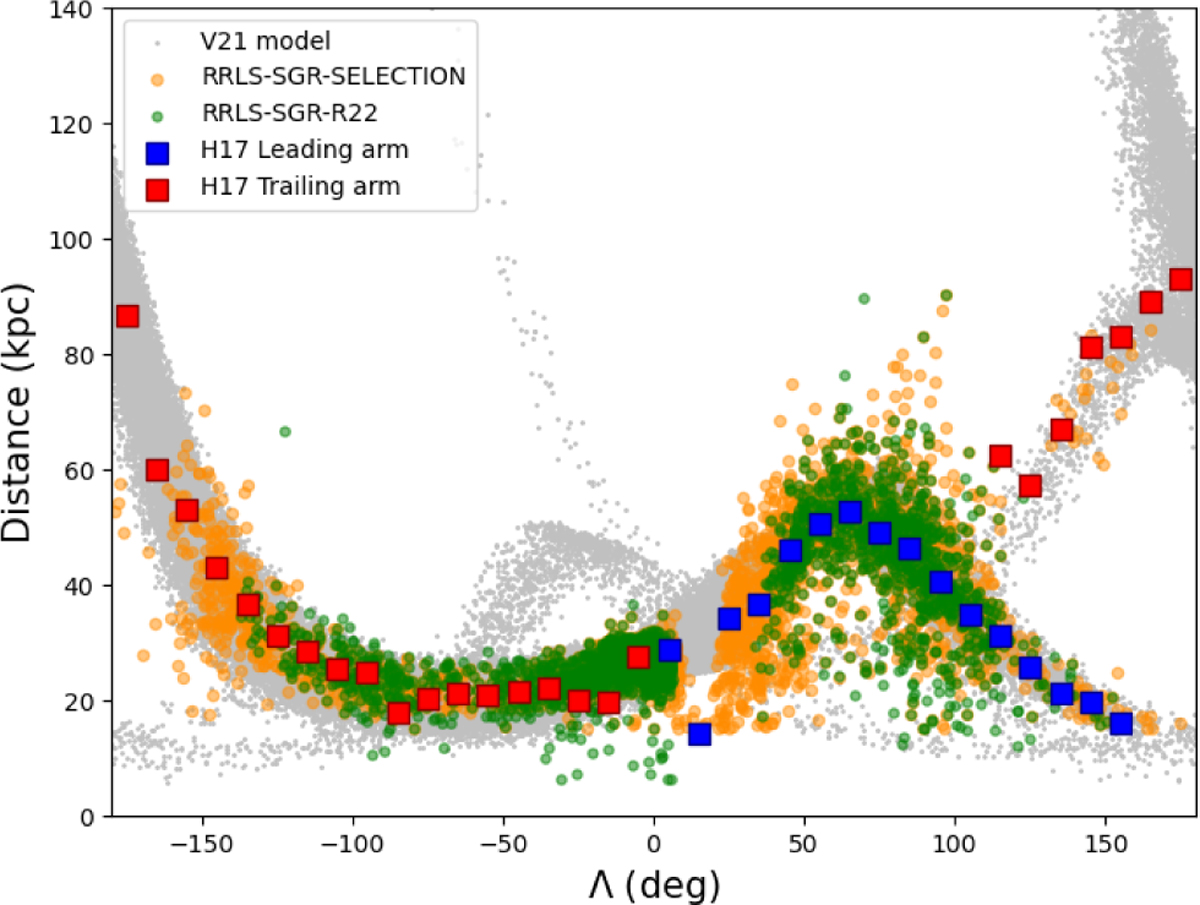
Distributions of stars simulated by the Vasiliev et al. (2021) model (gray points) and RRLs from the RRLS-SGR-R22 (green points) and RRLS-SGR-SELECTION (orange points) samples, in the distance versus Λ plane. Blue and red squares represent the mean distances as a function of Λ in the leading and trailing arms, respectively, as modeled by Hernitschek et al. (2017). The SgrΛ coordinate is given in the system introduced by Vasiliev et al. (2021).
Current usage metrics show cumulative count of Article Views (full-text article views including HTML views, PDF and ePub downloads, according to the available data) and Abstracts Views on Vision4Press platform.
Data correspond to usage on the plateform after 2015. The current usage metrics is available 48-96 hours after online publication and is updated daily on week days.
Initial download of the metrics may take a while.