Fig. 7
Download original image
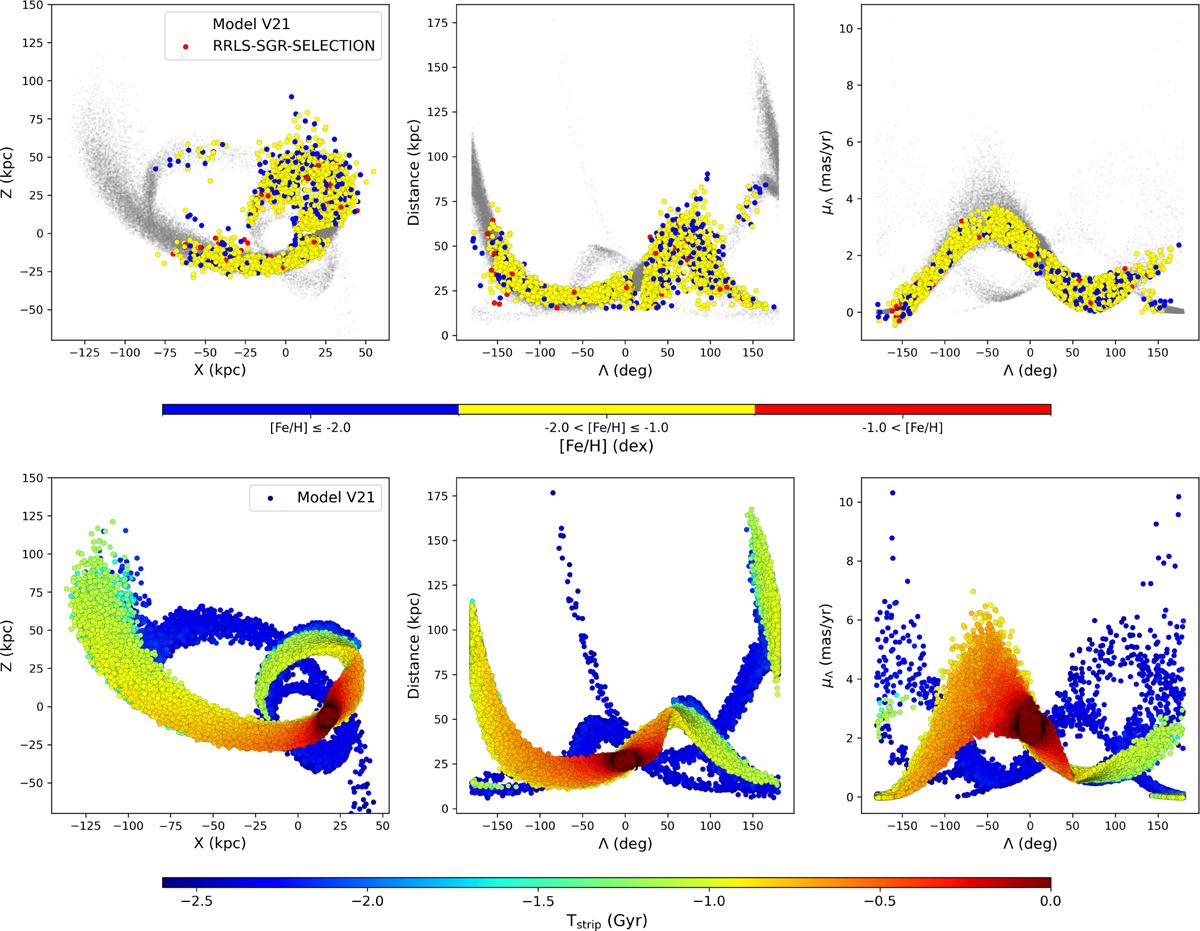
Upper panels: distributions of RRLs from the RRLS-SGR-SELECTION sample in the Cartesian Z versus X plane, the heliocentric distance versus the Sgr Λ coordinate plane, and the proper motion μΛ versus Λ plane, color-coded by metallicity. Lower panels: same distributions but for the sample of simulated stars from Vasiliev et al. (2021), color-coded by time of stripping from the Sgr progenitor.
Current usage metrics show cumulative count of Article Views (full-text article views including HTML views, PDF and ePub downloads, according to the available data) and Abstracts Views on Vision4Press platform.
Data correspond to usage on the plateform after 2015. The current usage metrics is available 48-96 hours after online publication and is updated daily on week days.
Initial download of the metrics may take a while.