Open Access
Fig. 8
Download original image
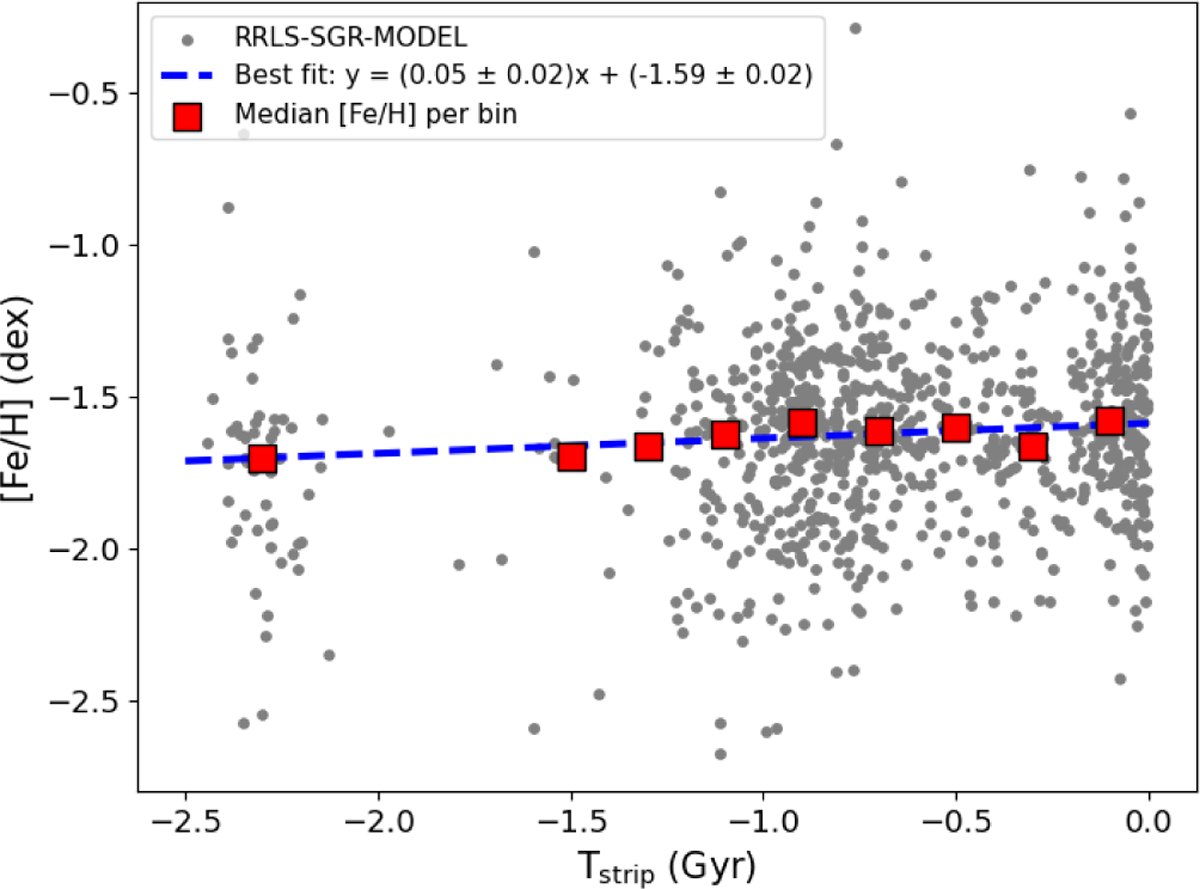
Metallicity as a function of stripping time (Tstrip) for RRLs from the RRLS-SGR-MODEL sample with Tstrip < 0 (gray dots). The red squares indicate median metallicities computed within bins containing more than ten RRLs. The dashed blue line represents the best linear fit to the median metallicity values.
Current usage metrics show cumulative count of Article Views (full-text article views including HTML views, PDF and ePub downloads, according to the available data) and Abstracts Views on Vision4Press platform.
Data correspond to usage on the plateform after 2015. The current usage metrics is available 48-96 hours after online publication and is updated daily on week days.
Initial download of the metrics may take a while.