Fig. 1
Download original image
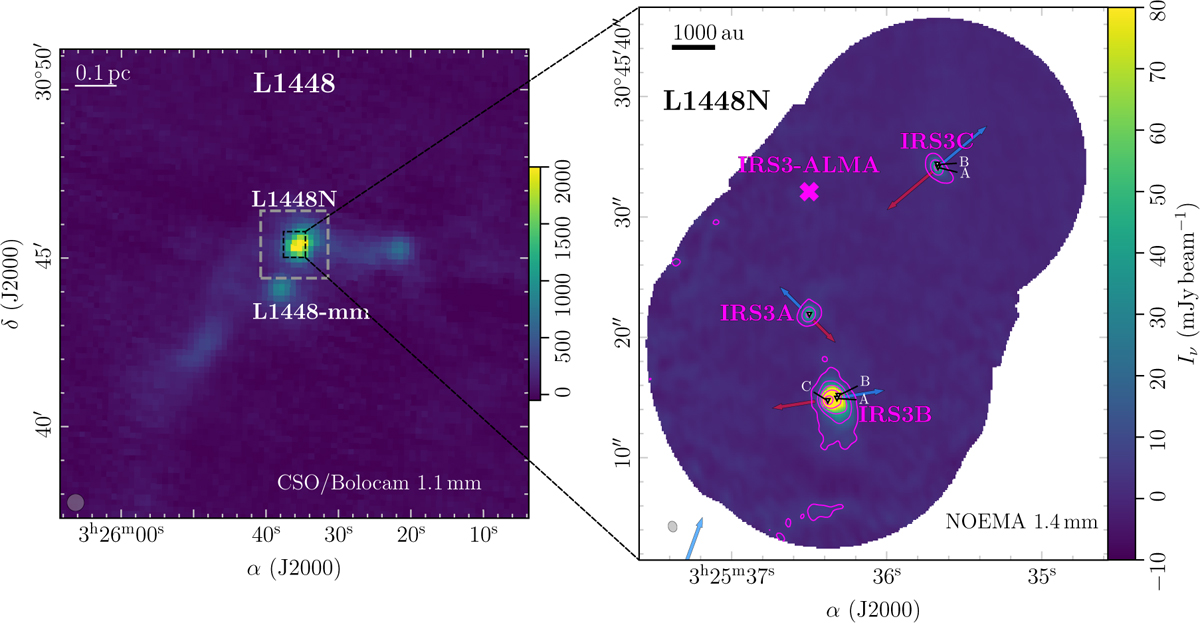
Continuum images toward L1448N. The left panel shows large-scale 1.1 mm continuum emission of L1448 (Enoch et al. 2006). The beam size is shown in the bottom left corner. The map size of the IRAM 30 m observations is highlighted by the dashed gray rectangle. The right panel shows the NOEMA 1.4 mm continuum of L1448N with contour levels at 5, 25, 60, 120, 200 times σcont with σcont = 0.78 mJy beam-1. The triangles and white labels mark the positions of individual protostars (Tobin et al. 2016), and the pink cross marks the recently detected source IRS3-ALMA (Looney et al. 2025). The bipolar outflow directions launched by the three protostellar systems are marked by red and blue arrows, including the blueshifted outflow lobe that is launched by L1448-mm toward the southeast. The synthesized beam of the NOEMA continuum data is shown in the bottom left corner. The scale bars in the two panels are shown in the top left corner.
Current usage metrics show cumulative count of Article Views (full-text article views including HTML views, PDF and ePub downloads, according to the available data) and Abstracts Views on Vision4Press platform.
Data correspond to usage on the plateform after 2015. The current usage metrics is available 48-96 hours after online publication and is updated daily on week days.
Initial download of the metrics may take a while.