Fig. 2
Download original image
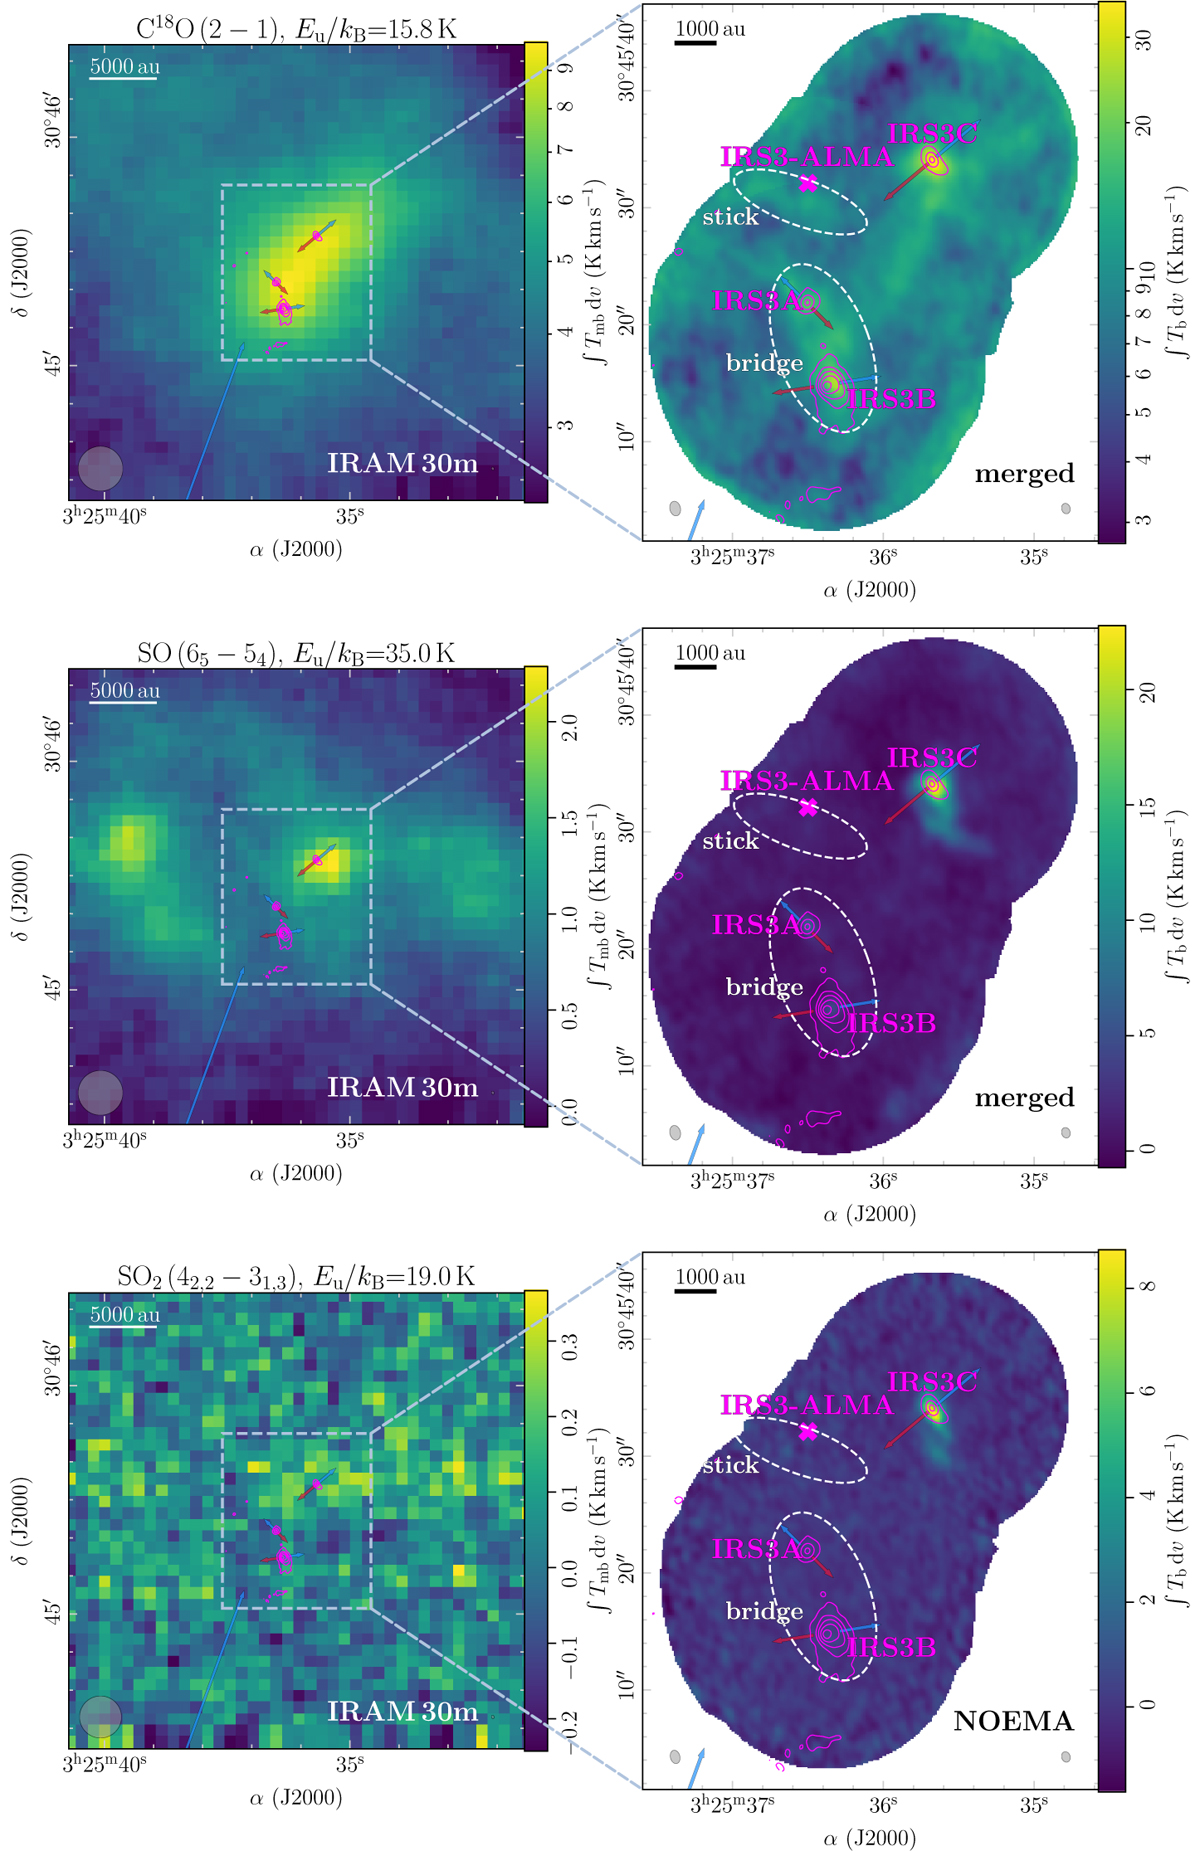
Line-integrated intensity map of C18O (2 - 1), SO (65 - 54), and SO2 (42,2 - 31,3) of the IRAM 30 m data (left) and merged or NOEMA data (right). The line-integrated intensity is shown in color in all panels. The contours and arrows are the same as in Fig. 1. The synthesized beam of the line and continuum data is shown in the bottom left and right corners, respectively. The scale bars are shown in the top left corner in all panels. In the right panels, distinct structures (bridge and stick) seen in molecular emission are indicated by dashed ellipses.
Current usage metrics show cumulative count of Article Views (full-text article views including HTML views, PDF and ePub downloads, according to the available data) and Abstracts Views on Vision4Press platform.
Data correspond to usage on the plateform after 2015. The current usage metrics is available 48-96 hours after online publication and is updated daily on week days.
Initial download of the metrics may take a while.