Fig. 7
Download original image
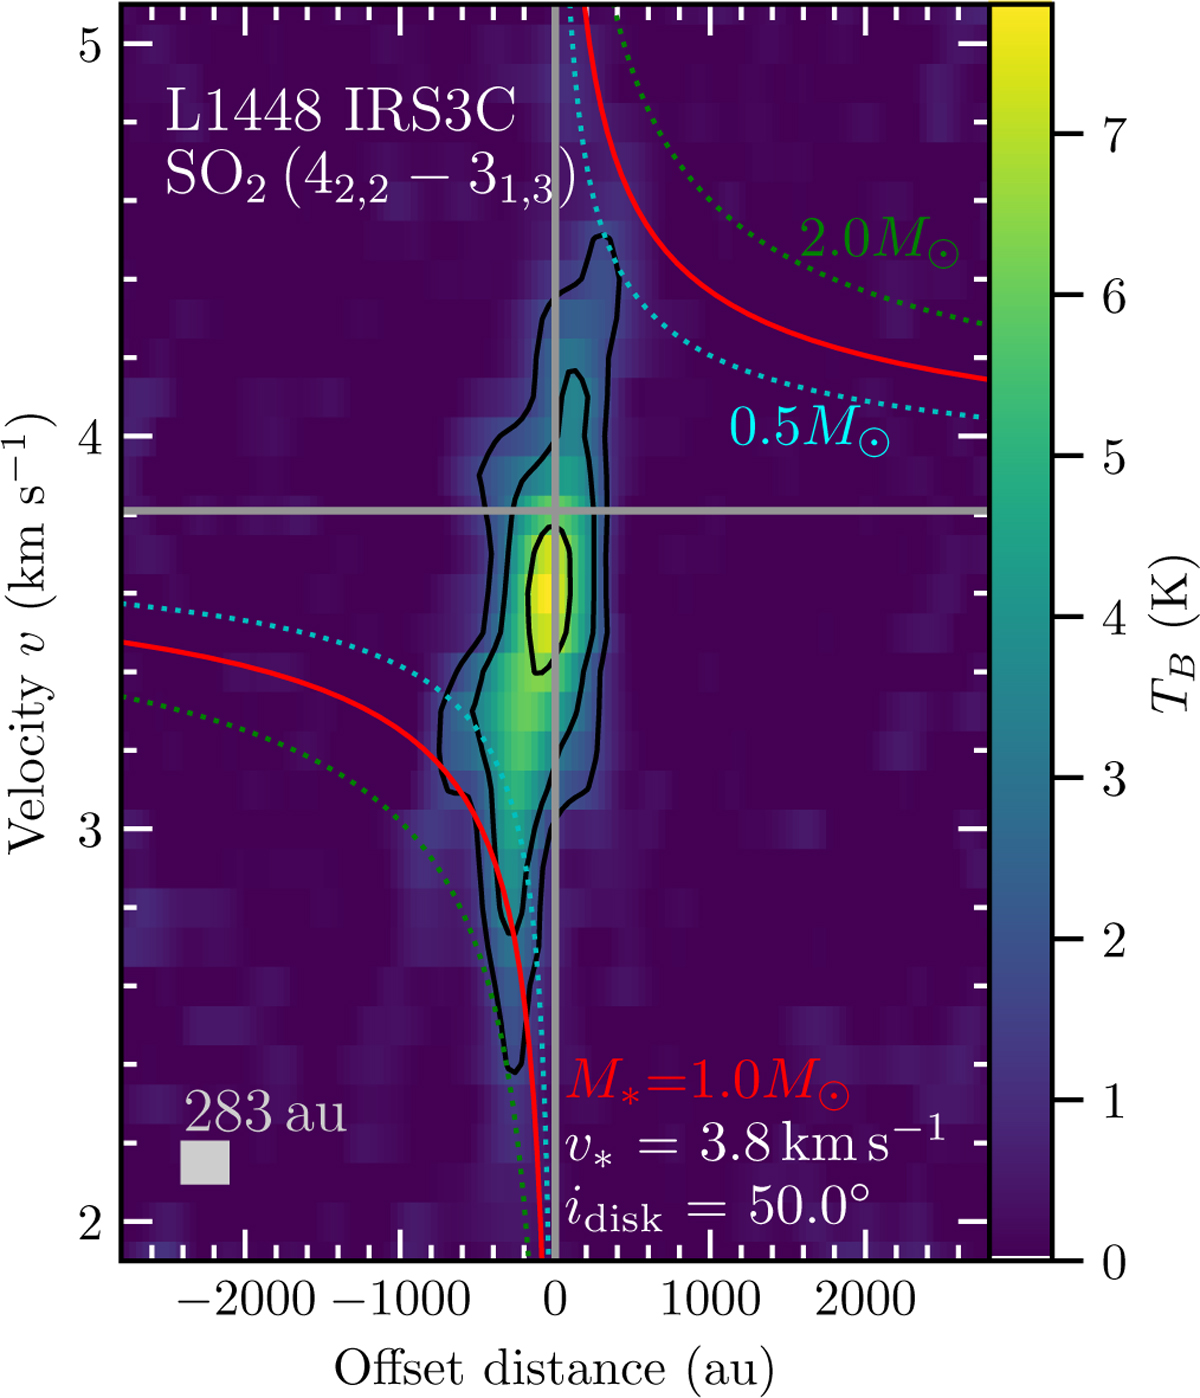
Position velocity diagram of SO2 (42,2 - 31,3) extracted along the disk orientation of IRS3C. The black contours show the 4, 8, and 16σline levels. The red line shows the profile for a Keplerian disk of 1 M⊙ inclined by 50°, and for comparison, the dotted cyan and green lines show profiles for 0.5 M⊙ and 2 M⊙, respectively. A spectral and spatial resolution element (0.1 km s-1 ×283 au) is indicated in the bottom left corner.
Current usage metrics show cumulative count of Article Views (full-text article views including HTML views, PDF and ePub downloads, according to the available data) and Abstracts Views on Vision4Press platform.
Data correspond to usage on the plateform after 2015. The current usage metrics is available 48-96 hours after online publication and is updated daily on week days.
Initial download of the metrics may take a while.