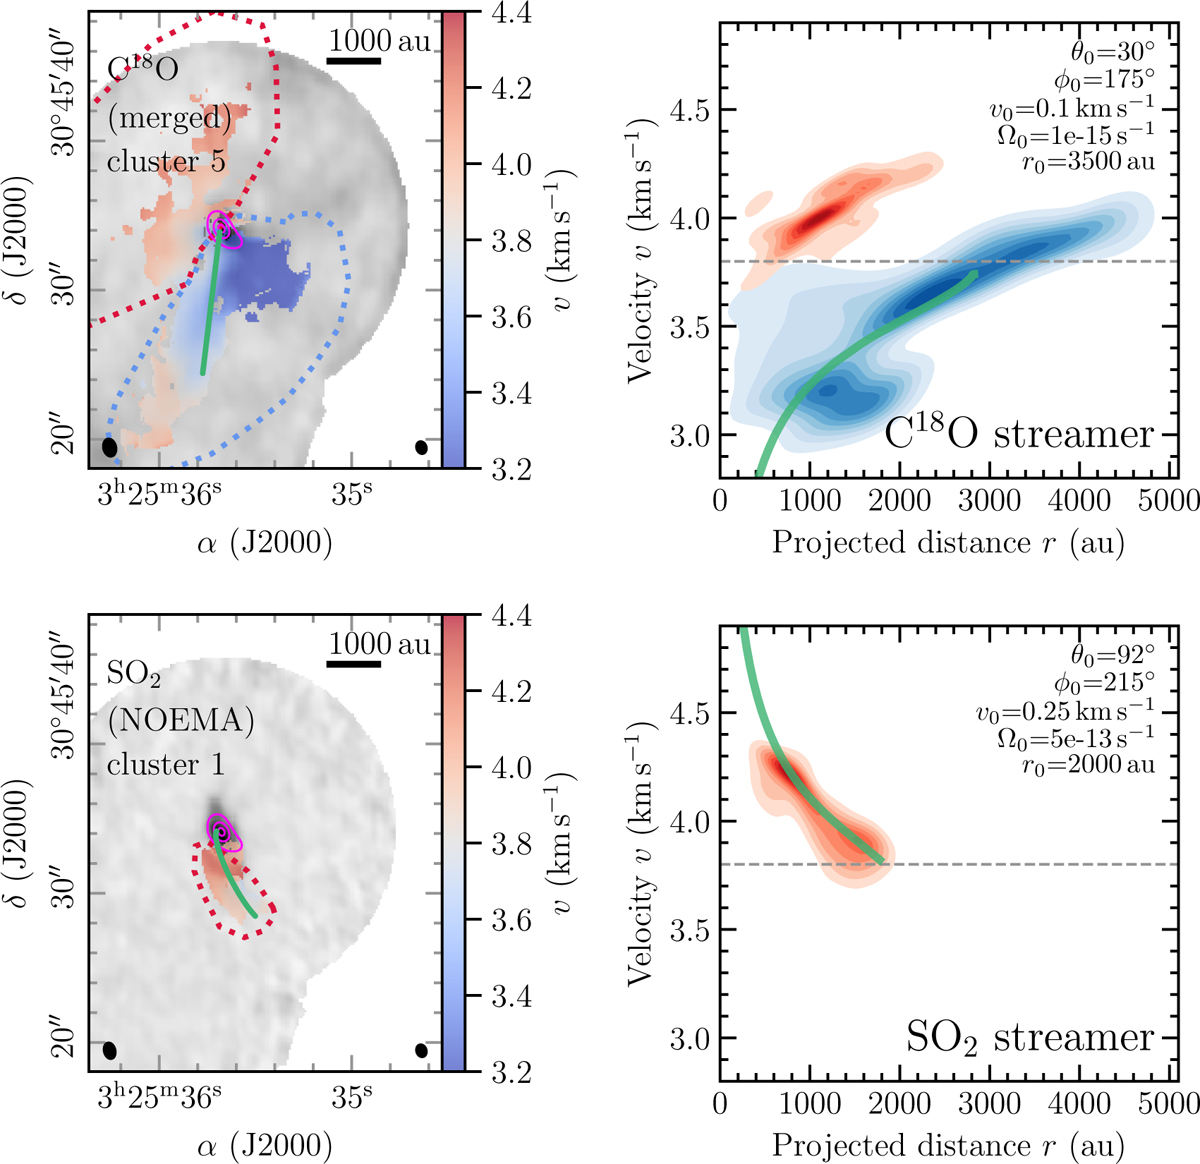
Fig. 8
Download original image
Streamline models toward IRS3C. In the left panels, the line-integrated intensity and the velocities of the structure are shown in gray and color, respectively. The trajectory of the best-match streamline model is shown in green. The contours are the NOEMA 1.4 mm continuum with the same levels as in Fig. 1. The beam of the line and continuum data are shown in the bottom left and right corners, respectively. A scale bar is shown in the top right corner. In the right panels, we indicate the velocity distribution extracted from the areas by dotted ellipses (left) in red or blue, and the best-match streamline model is shown in green. The source velocity of IRS3C (3.8 km s-1) is indicated by the horizontal dashed line.
Current usage metrics show cumulative count of Article Views (full-text article views including HTML views, PDF and ePub downloads, according to the available data) and Abstracts Views on Vision4Press platform.
Data correspond to usage on the plateform after 2015. The current usage metrics is available 48-96 hours after online publication and is updated daily on week days.
Initial download of the metrics may take a while.