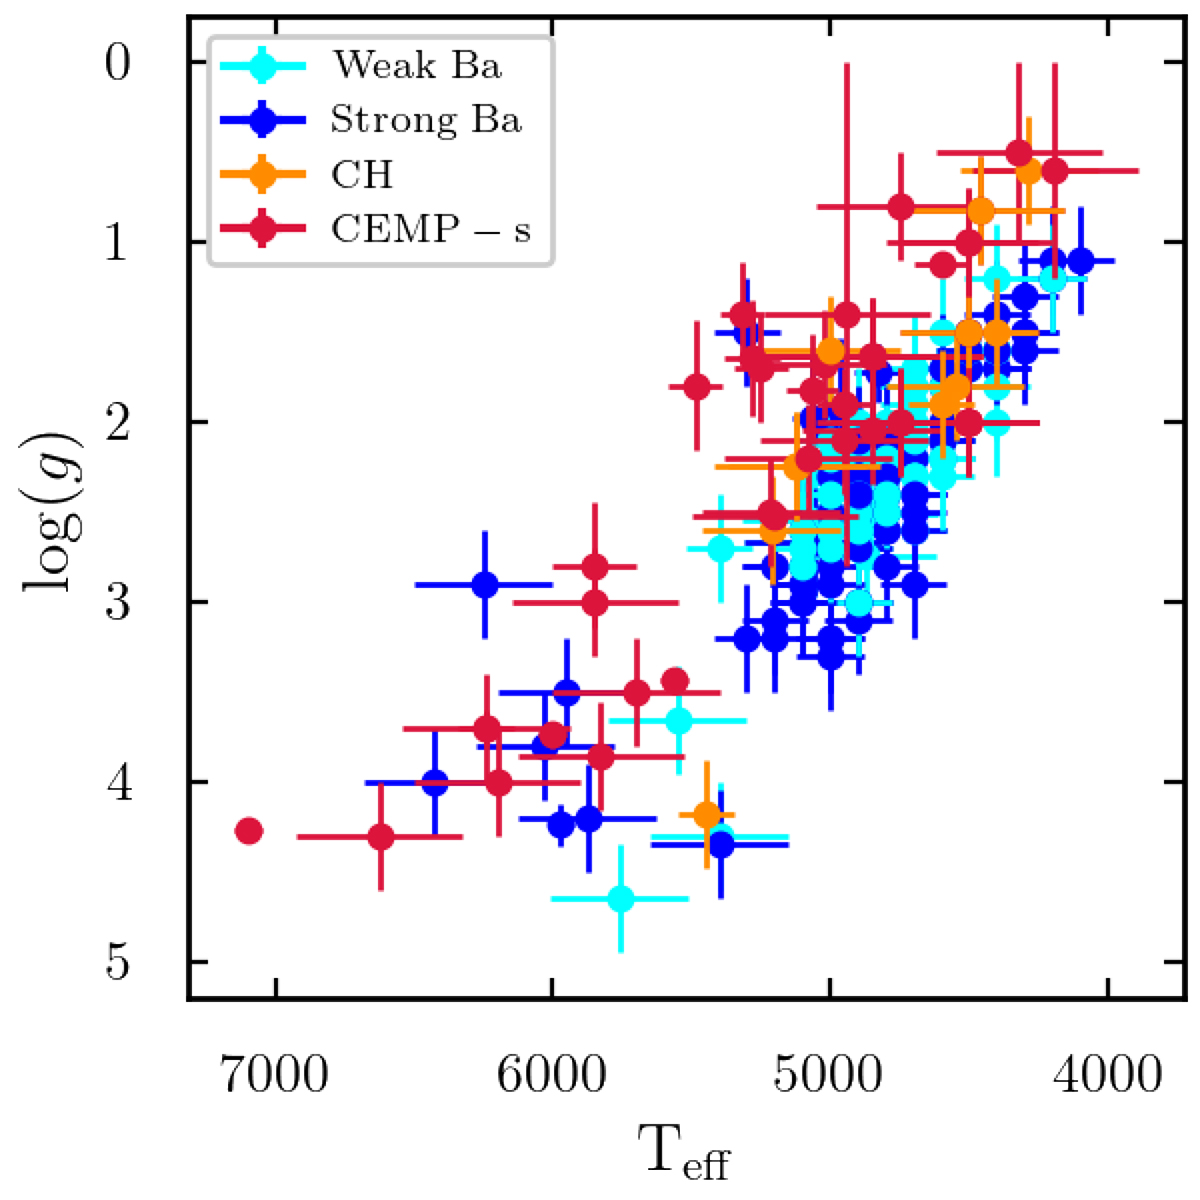
Fig. 1.
Download original image
Kiel diagram showing surface gravities and effective temperatures for the collected observational sample. Blue data points are strong Ba stars, cyan data points are weak Ba stars, orange data points are CH stars, and red data points are CEMP-s stars. Surface parameters and abundances are collected from Dimoff et al. (2024), de Castro et al. (2016), Roriz et al. (2021a), Goswami et al. (2006, 2016, 2021), Karinkuzhi & Goswami (2014, 2015).
Current usage metrics show cumulative count of Article Views (full-text article views including HTML views, PDF and ePub downloads, according to the available data) and Abstracts Views on Vision4Press platform.
Data correspond to usage on the plateform after 2015. The current usage metrics is available 48-96 hours after online publication and is updated daily on week days.
Initial download of the metrics may take a while.