Fig. 2.
Download original image
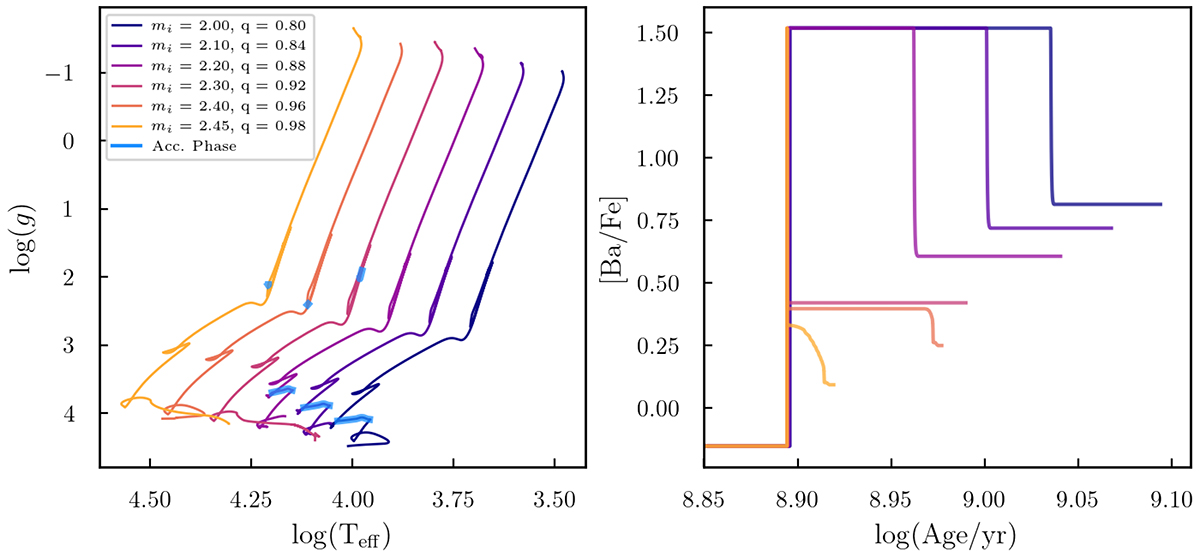
Left: Evolutionary tracks for a sample of stars with mfinal = 2.50 M⊙ at [Fe/H] = −0.15 with varying initial masses and accretion masses, with accretion phases for each model highlighted in blue. Right: Relative surface abundance of the s-process element Ba with log10(Age/yr). The abundance is elevated after the accretion phase, and after the onset of first dredge-up the surface abundance is diluted.
Current usage metrics show cumulative count of Article Views (full-text article views including HTML views, PDF and ePub downloads, according to the available data) and Abstracts Views on Vision4Press platform.
Data correspond to usage on the plateform after 2015. The current usage metrics is available 48-96 hours after online publication and is updated daily on week days.
Initial download of the metrics may take a while.