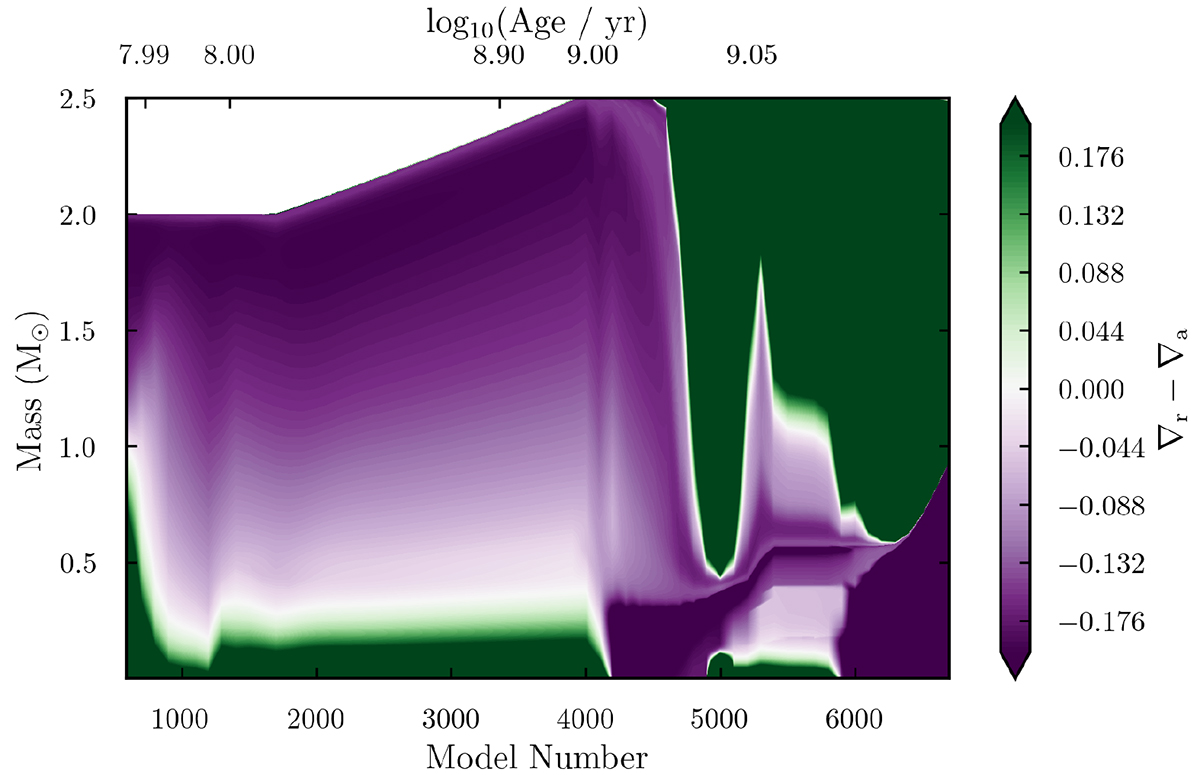
Fig. 3.
Download original image
Example Kippenhahn diagram for a 2.00 M⊙ star accreting 0.50 M⊙ of material from a 2.50 M⊙ AGB star at a metallicity of [Fe/H] = − 0.15. Green colors denote convective regions, and purple colors denote radiative regions, determined by the computed difference in the radiative and adiabatic transfer gradients. In the total mass on the y axis, the accretion phase can be identified by the increase in mass. The upper x axis shows log10(Age/yr), and the lower x axis shows the model number, which is highly nonlinear with respect to time.
Current usage metrics show cumulative count of Article Views (full-text article views including HTML views, PDF and ePub downloads, according to the available data) and Abstracts Views on Vision4Press platform.
Data correspond to usage on the plateform after 2015. The current usage metrics is available 48-96 hours after online publication and is updated daily on week days.
Initial download of the metrics may take a while.