Open Access
Fig. 7.
Download original image
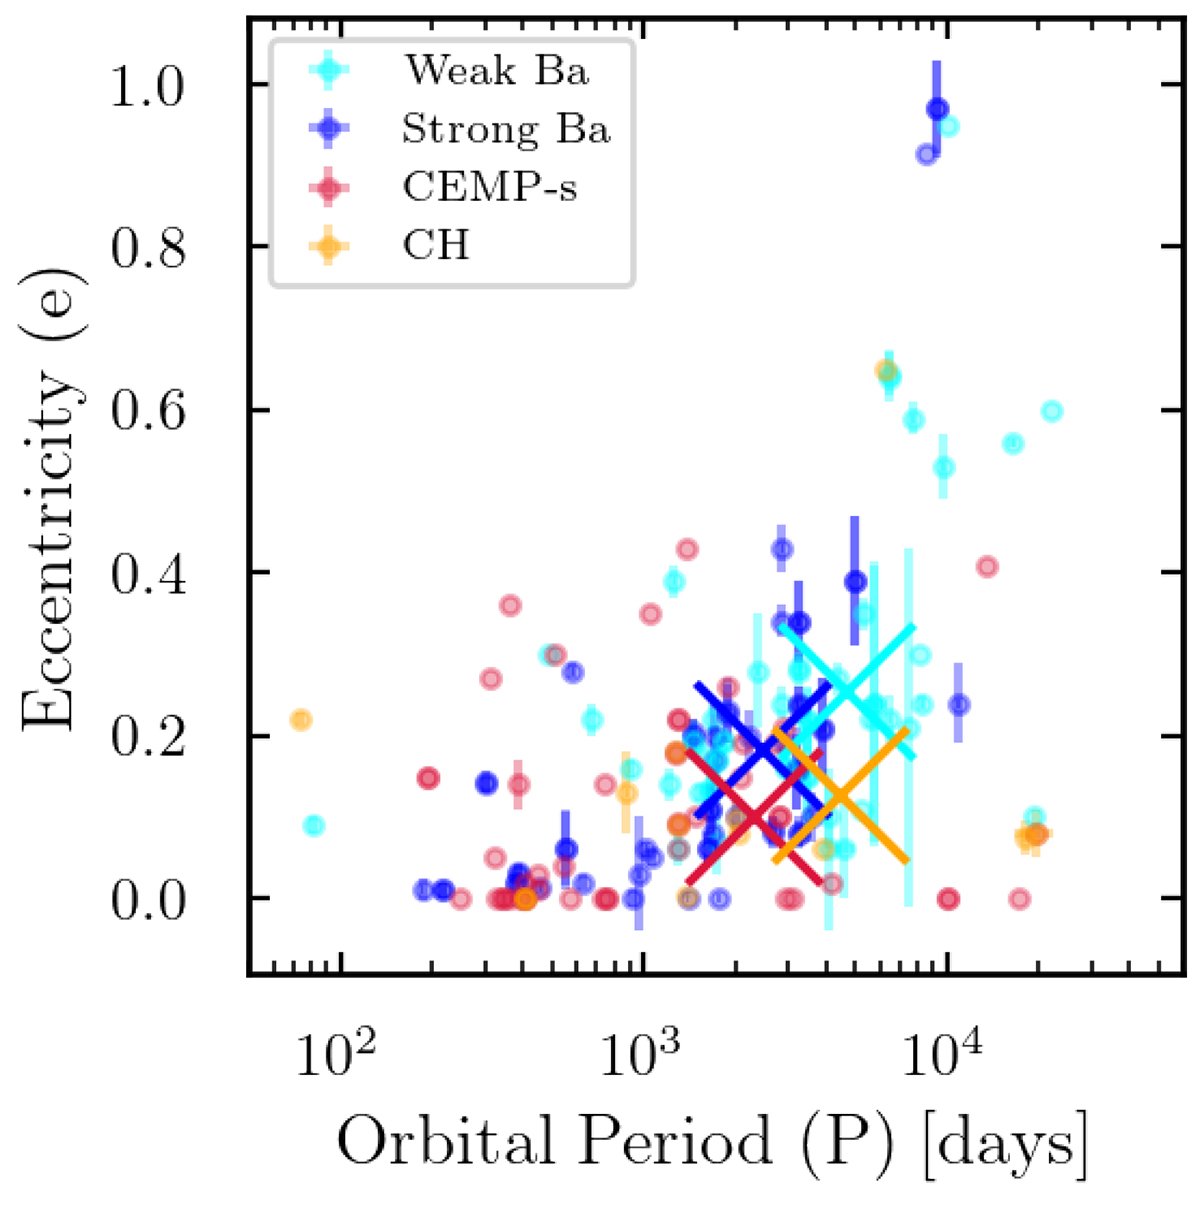
Eccentricity-period diagram for our combined sample of stars. Cyan data points are weak Ba stars, blue data points are strong Ba stars, orange data points are CH stars, and crimson data points are the CEMP-s stars. Centroids of the populations are marked with X’s of corresponding colors.
Current usage metrics show cumulative count of Article Views (full-text article views including HTML views, PDF and ePub downloads, according to the available data) and Abstracts Views on Vision4Press platform.
Data correspond to usage on the plateform after 2015. The current usage metrics is available 48-96 hours after online publication and is updated daily on week days.
Initial download of the metrics may take a while.