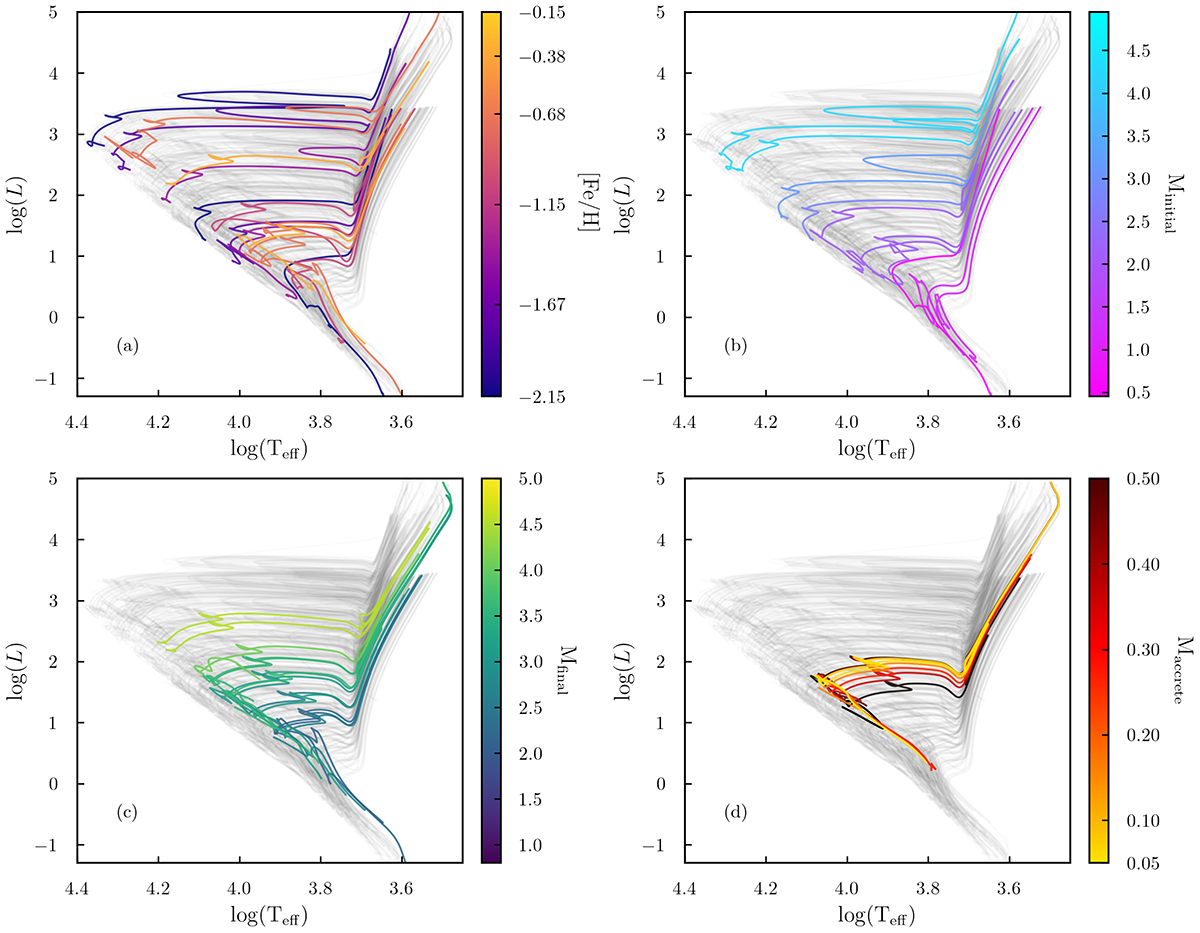
Fig. A.1.
Download original image
Our computed grid of evolutionary models in the HR diagram, displaying every 5th model in gray. Selected models are highlighted to show the range of parameters across the grid. Panel (a) shows the varying metallicities of our models, with purple models at lower metallicity and orange models at higher metallicities. These are spread across the Kiel diagram. On the giant branch, metal-rich evolutionary tracks fall to the right side of the giant branch toward cooler temperatures, where metal-poor giants are on the left side at higher temperatures. Panel (b) shows the range of initial masses, with lower initial masses in blue and higher initial masses in pink. Lower initial-mass models appear toward the bottom and right of the panel, and higher initial-mass models to top and the left. Panel (c) shows the range of final masses. The highlighted evolutionary tracks are for a fixed metallicity of -0.15, with green and yellow models showing higher mass and blue models showing lower mass. This parameter follows the same general trend as the initial masses. Panel (d) displays an example of the varying accretion mass in our models. The highlighted tracks begin at different initial masses all resulting in mfinal = 2.50 M⊙, at a metallicity of [Fe/H] = -0.15. Black tracks show higher accretion masses, and yellow tracks show lower amounts of accretion.
Current usage metrics show cumulative count of Article Views (full-text article views including HTML views, PDF and ePub downloads, according to the available data) and Abstracts Views on Vision4Press platform.
Data correspond to usage on the plateform after 2015. The current usage metrics is available 48-96 hours after online publication and is updated daily on week days.
Initial download of the metrics may take a while.