Fig. A.6
Download original image
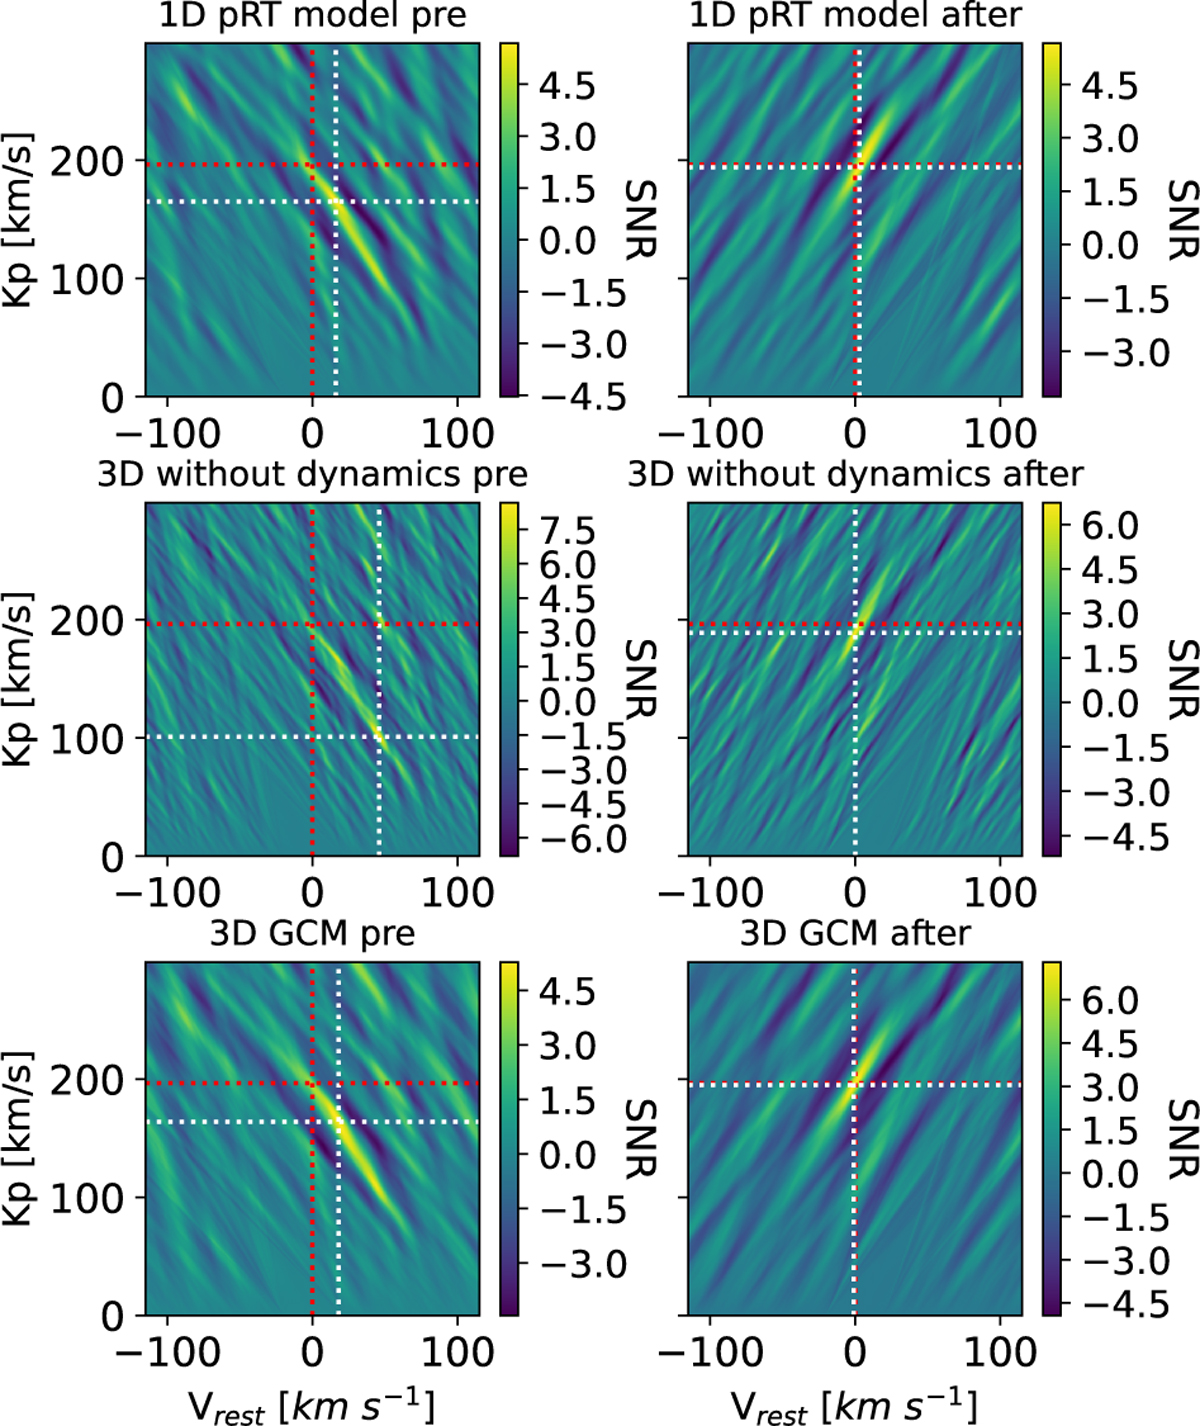
Detection of Fe I with ESPRESSO during pre-eclipse (left panels) and post-eclipse (right panels). For each atmospheric model (top row: 1D pRT; middle row: 3D without dynamics; bottom row: 3D nodrag GCM), we present the two-dimensional CC maps in the (Kp, Vrest) plane, expressed in terms of S/N (see Fig. A.1 for more details).
Current usage metrics show cumulative count of Article Views (full-text article views including HTML views, PDF and ePub downloads, according to the available data) and Abstracts Views on Vision4Press platform.
Data correspond to usage on the plateform after 2015. The current usage metrics is available 48-96 hours after online publication and is updated daily on week days.
Initial download of the metrics may take a while.