Fig. A.7
Download original image
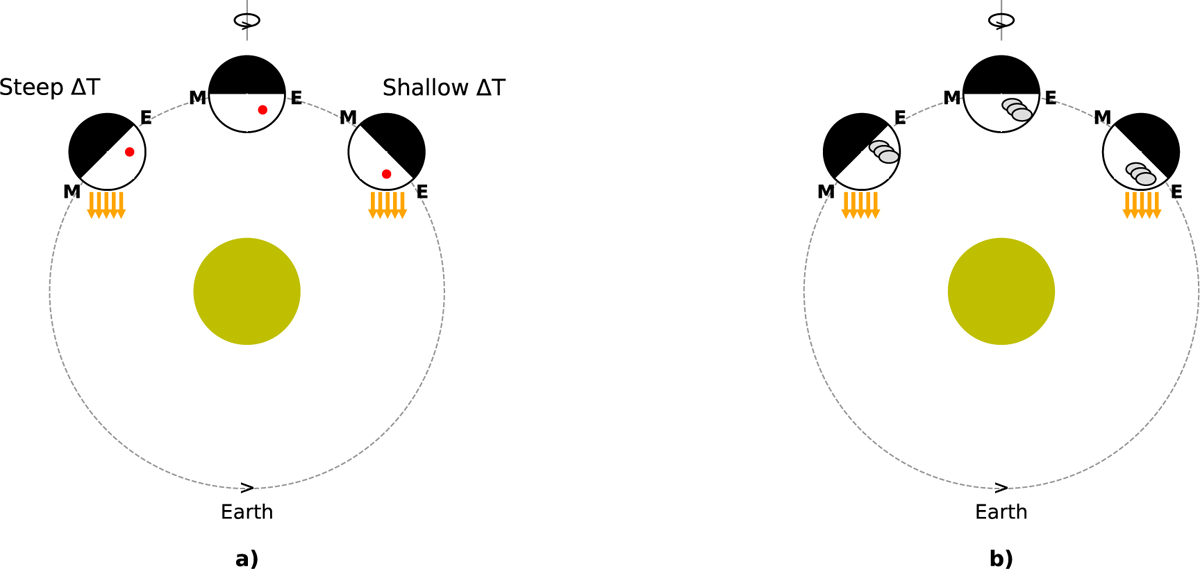
Possible explanation for the asymmetry of our detection. a) panel, the asymmetry could be due to the eastward shift of the hotspot. During the pre-eclipse phase (when we observe the eastern side with the hotspot), the observed temperature gradient is shallower. The temperature gradient is steeper during the post-eclipse phase (when we observe more of the western side). As a result, the spectral line contrast (linked to these gradients) will be weaker before the eclipse and stronger after the eclipse. b) panel, the fainter detection during pre-eclipse compared to post-eclipse observations could be due to the presence of clouds and the associated glory effect in the eastern hemisphere, a hint of this could be the hotspot offset detected in the optical CHEOPS and TESS light curves.
Current usage metrics show cumulative count of Article Views (full-text article views including HTML views, PDF and ePub downloads, according to the available data) and Abstracts Views on Vision4Press platform.
Data correspond to usage on the plateform after 2015. The current usage metrics is available 48-96 hours after online publication and is updated daily on week days.
Initial download of the metrics may take a while.