Fig. 3
Download original image
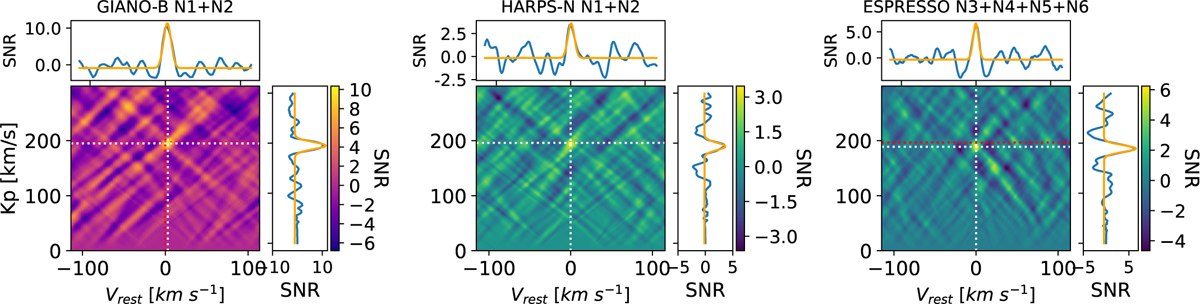
Detection S/N maps as a function of Vrest and Kp for CO in GIANO-B (left panel), Fe I in HARPS-N (central panel), and Fe I in ESPRESSO (right panel) data. Dotted red and white lines mark the expected and obtained planetary positions, respectively. For each map, the top and right sub-panels show the 1D CC functions (in terms of S/N) at the peak position, with the best-fit Gaussian overplotted in orange.
Current usage metrics show cumulative count of Article Views (full-text article views including HTML views, PDF and ePub downloads, according to the available data) and Abstracts Views on Vision4Press platform.
Data correspond to usage on the plateform after 2015. The current usage metrics is available 48-96 hours after online publication and is updated daily on week days.
Initial download of the metrics may take a while.