Fig. A.1
Download original image
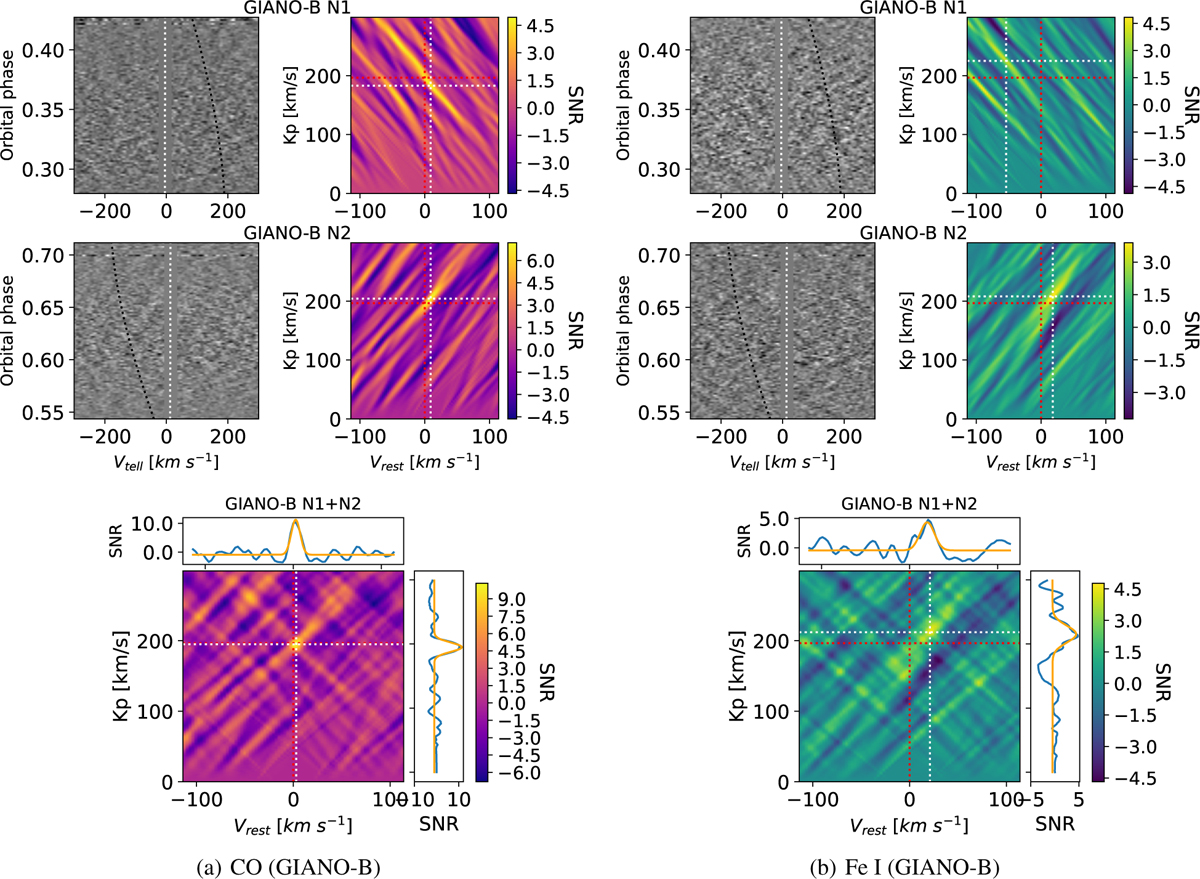
Cross-correlation results for CO (left panels) and Fe I (right panels) in GIANO-B data. For each species, we show the results for individual nights (top two rows) and their combined signal (bottom row). The greyscale maps represent the CC functions as a function of velocity in the telluric rest frame (Vtell) and orbital phase. Masked regions are affected by stellar residuals (see Sect. 3). The black and white dashed lines indicate the stellar and planetary trails, respectively.
Current usage metrics show cumulative count of Article Views (full-text article views including HTML views, PDF and ePub downloads, according to the available data) and Abstracts Views on Vision4Press platform.
Data correspond to usage on the plateform after 2015. The current usage metrics is available 48-96 hours after online publication and is updated daily on week days.
Initial download of the metrics may take a while.