Fig. A.4
Download original image
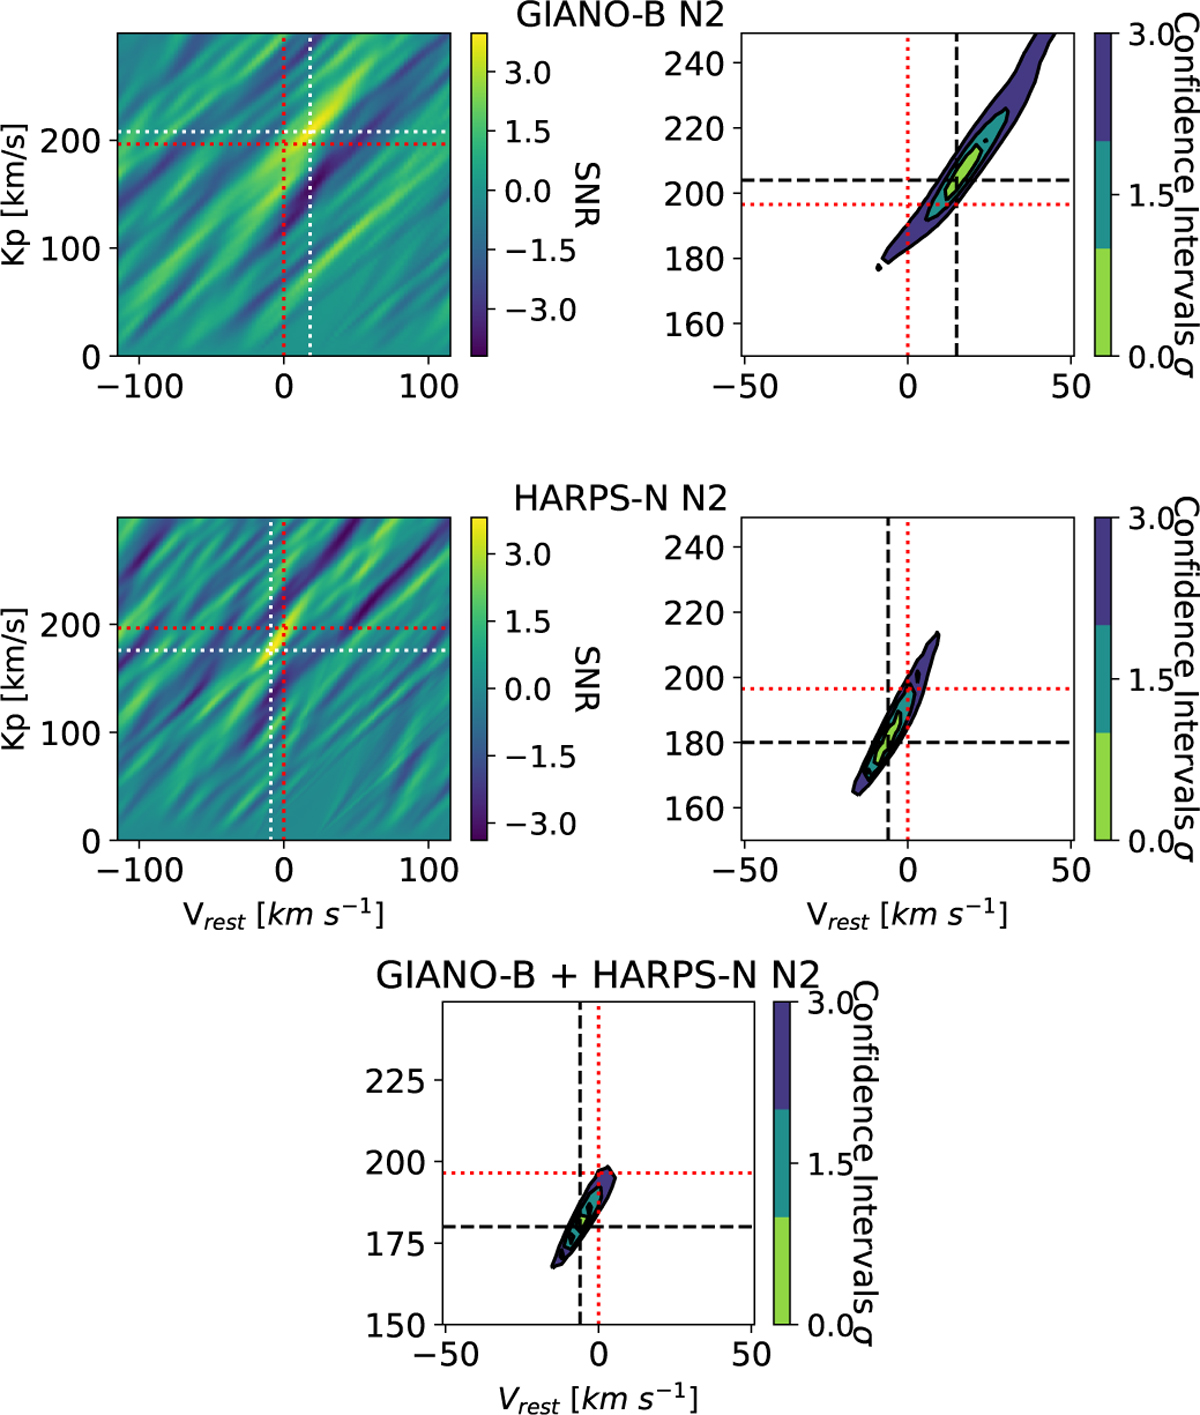
Fe I detection with GIARPS during Night 2. For each instrument (top row: GIANO-B; middle row: HARPS-N), we present: the 2D CC maps in the (Kp, Vrest) plane, expressed in terms of S/N (left panels, colour scale); and the corresponding likelihood confidence interval maps (right panels). The bottom row shows the combined GIANO-B + HARPS-N confidence interval maps. Although the detection is primarily driven by HARPS-N, GIANO-B contributes by cleaning the signal and reducing spurious peaks in the likelihood maps.
Current usage metrics show cumulative count of Article Views (full-text article views including HTML views, PDF and ePub downloads, according to the available data) and Abstracts Views on Vision4Press platform.
Data correspond to usage on the plateform after 2015. The current usage metrics is available 48-96 hours after online publication and is updated daily on week days.
Initial download of the metrics may take a while.