Fig. 3.
Download original image
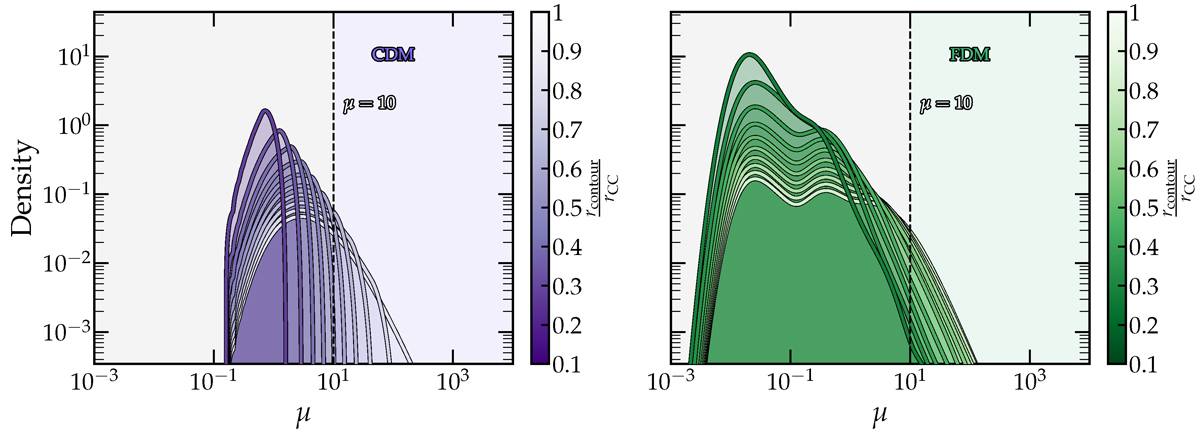
Probability of magnification estimated within smooth CDM isomagnification contours for the CDM profile (left) and corresponding FDM simulations (right). Brighter colours represent larger contours, with the outermost matching the radial CC, while darker colours correspond to smaller contours closer to the centre of the halo. The dashed black vertical line marks a magnification value of ten, which we set as the threshold for comparing p-values.
Current usage metrics show cumulative count of Article Views (full-text article views including HTML views, PDF and ePub downloads, according to the available data) and Abstracts Views on Vision4Press platform.
Data correspond to usage on the plateform after 2015. The current usage metrics is available 48-96 hours after online publication and is updated daily on week days.
Initial download of the metrics may take a while.