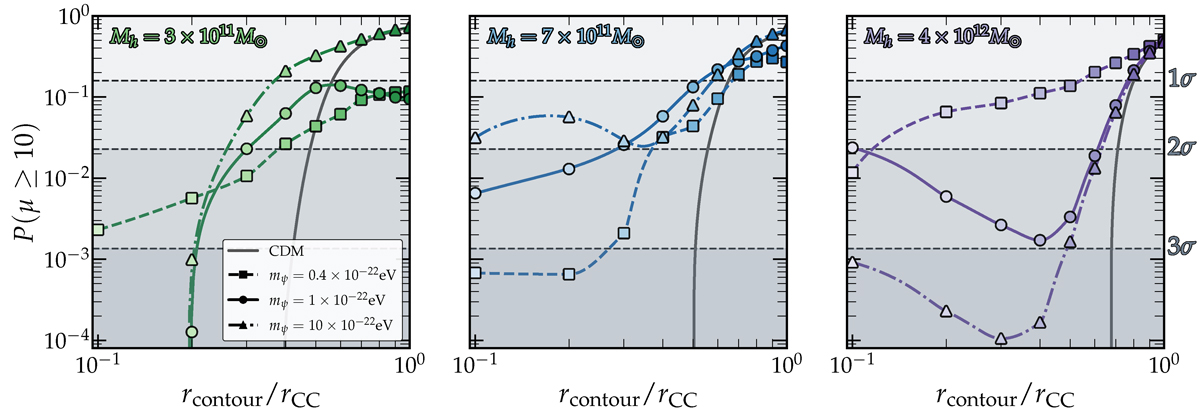
Fig. 4.
Download original image
p-values for a magnification factor equal to or larger than ten for each of the simulated lenses. The left panel shows the p-values for the lightest halo mass (3 × 10¹¹ M⊙) for all axion masses. Middle and right panels show the equivalent p-values for the 7 × 10¹¹ M⊙ and 4 × 10¹² M⊙ haloes, respectively. The grey lines represent the complementary p-values for the CDM model at each halo mass. Halo masses increase from left to right with green, blue, and purple colours. The squares, circles, and triangles represent different axion masses, increasing in this order. Dashed, horizontal lines indicate the significance of finding an image with magnification equal to or greater than ten for each model. For the smooth model, it is virtually impossible to achieve such magnification at a distance to the centre of the halo equal to half that of the CC.
Current usage metrics show cumulative count of Article Views (full-text article views including HTML views, PDF and ePub downloads, according to the available data) and Abstracts Views on Vision4Press platform.
Data correspond to usage on the plateform after 2015. The current usage metrics is available 48-96 hours after online publication and is updated daily on week days.
Initial download of the metrics may take a while.