Fig. 7.
Download original image
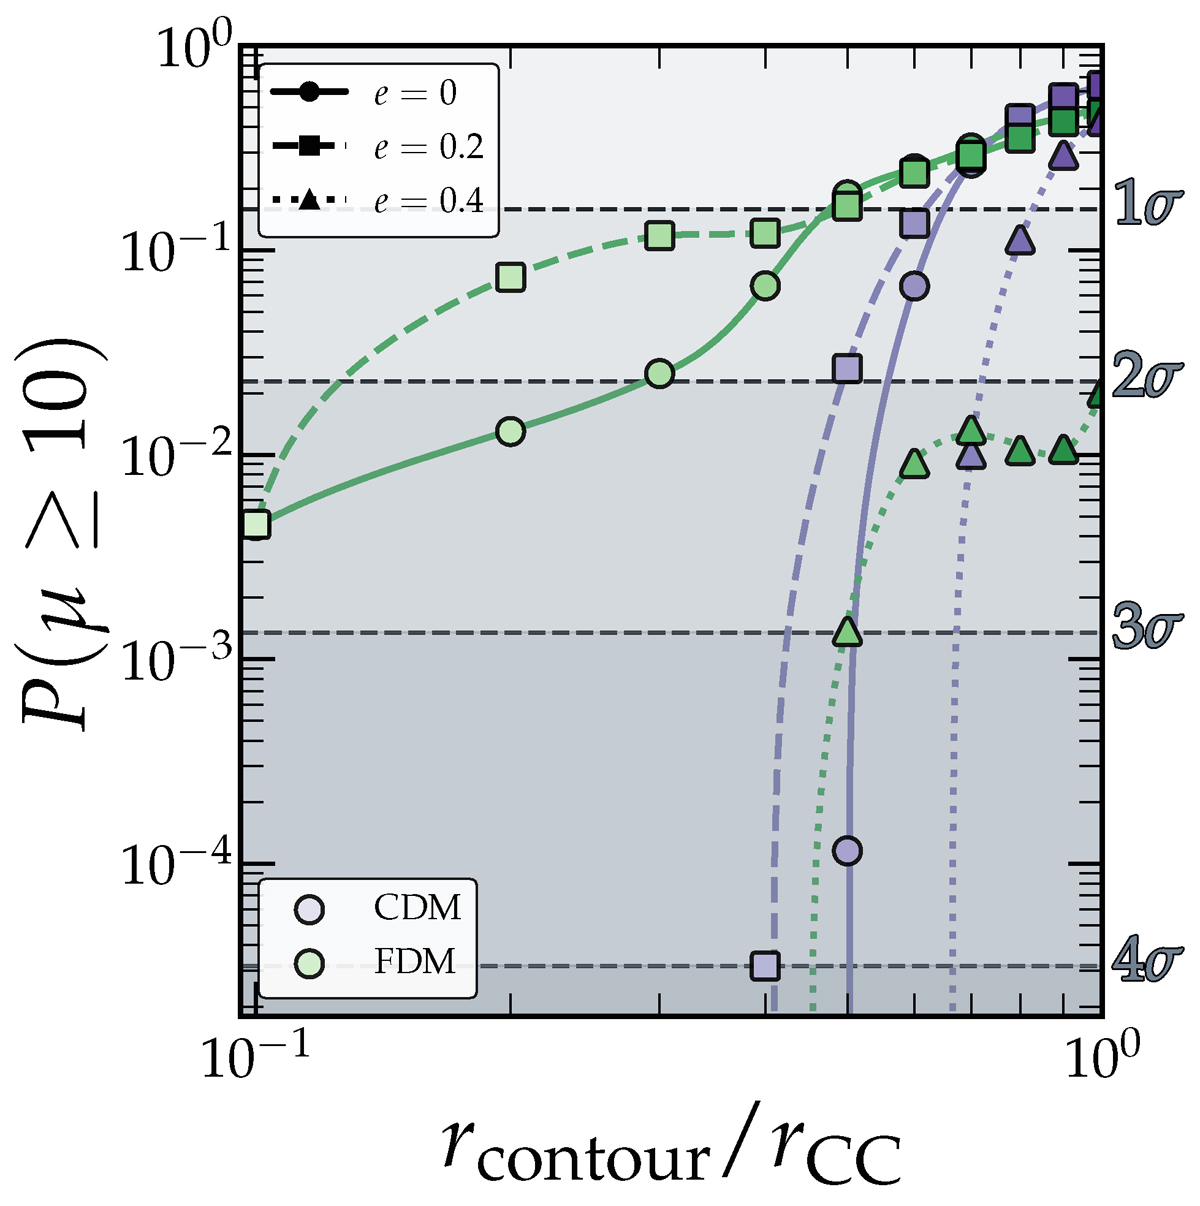
p-values for magnification values equal to or greater than ten in both the smooth CDM model (purple), and the wave-like FDM model (green). Each point represents the p-value calculated for pixels inside the scaled CC contours, with a size expressed as a fraction of the radial CC size (r/rCC). Different marker symbols denote the p-values corresponding to different ellipticity realizations. As in Fig. 4, the p-value is the probability within the given model of attaining a magnification equal to or greater than ten. Dashed, horizontal dashed lines indicate the significance contours. The halo and axion masses correspond to model 22 in Table 1, with Mh = 7 × 10¹¹ M⊙ and mψ = 10−22 eV.
Current usage metrics show cumulative count of Article Views (full-text article views including HTML views, PDF and ePub downloads, according to the available data) and Abstracts Views on Vision4Press platform.
Data correspond to usage on the plateform after 2015. The current usage metrics is available 48-96 hours after online publication and is updated daily on week days.
Initial download of the metrics may take a while.