Fig. 9.
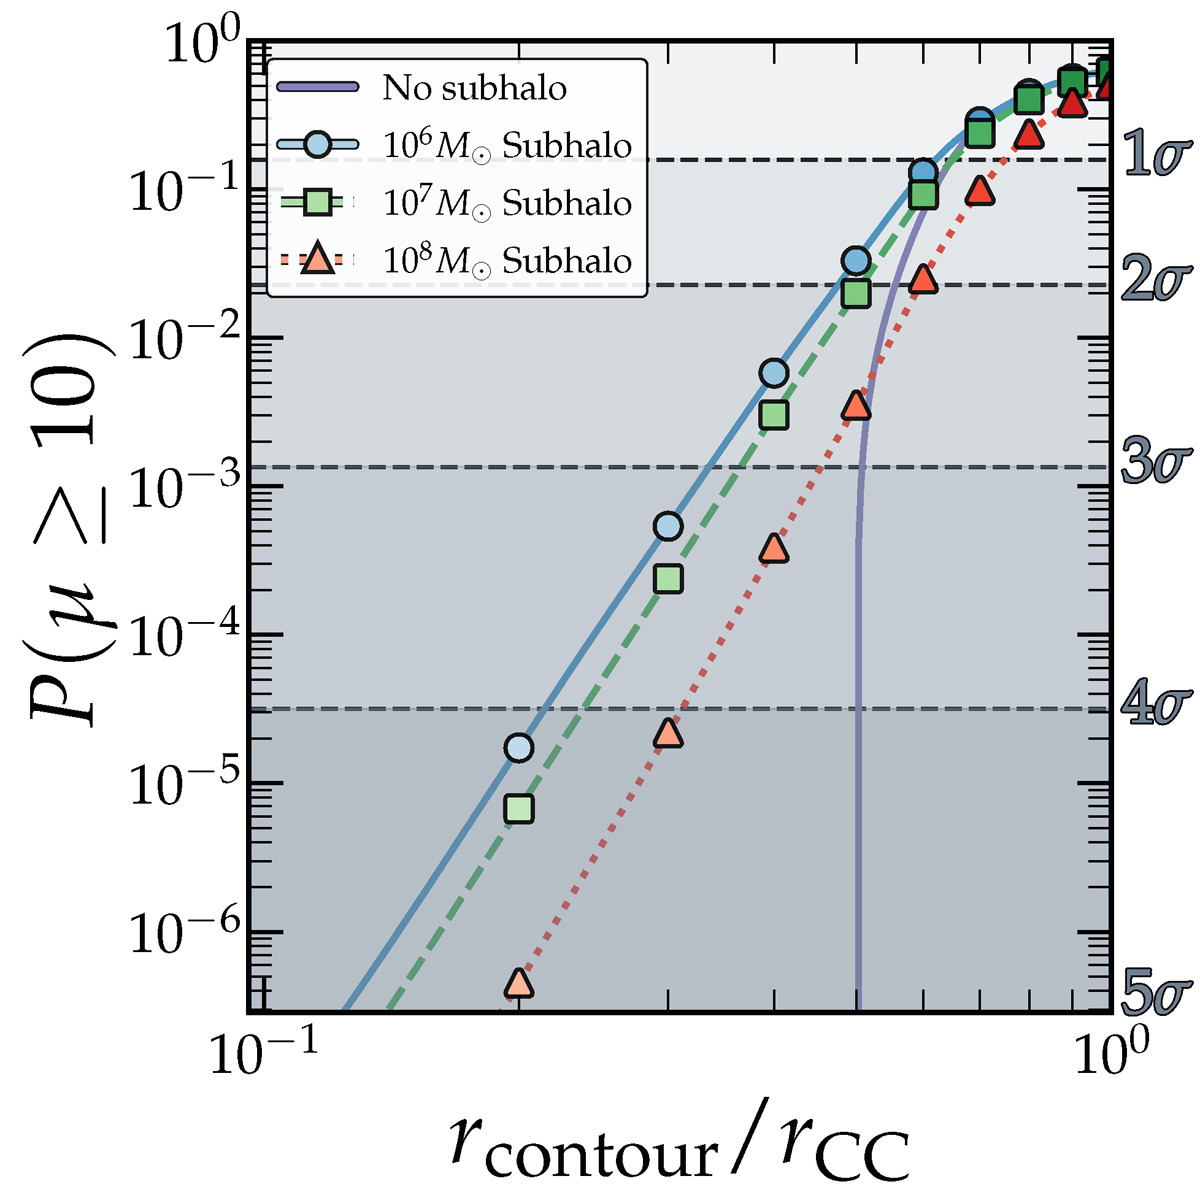
Download original image
Same as Fig. 8, showing p-values for magnifications equal to or greater than ten in the smooth CDM model and after adding subhaloes. In this case, the subhalo mass varies between realisations, as colour-coded in the legend, while its position is fixed at half the radius of the radial critical curve from the centre of the main halo. The halo and axion masses correspond to model 22 in Table 1, with Mh = 7 × 10¹¹ M⊙ and mψ = 10−22 eV.
Current usage metrics show cumulative count of Article Views (full-text article views including HTML views, PDF and ePub downloads, according to the available data) and Abstracts Views on Vision4Press platform.
Data correspond to usage on the plateform after 2015. The current usage metrics is available 48-96 hours after online publication and is updated daily on week days.
Initial download of the metrics may take a while.