Fig. 2
Download original image
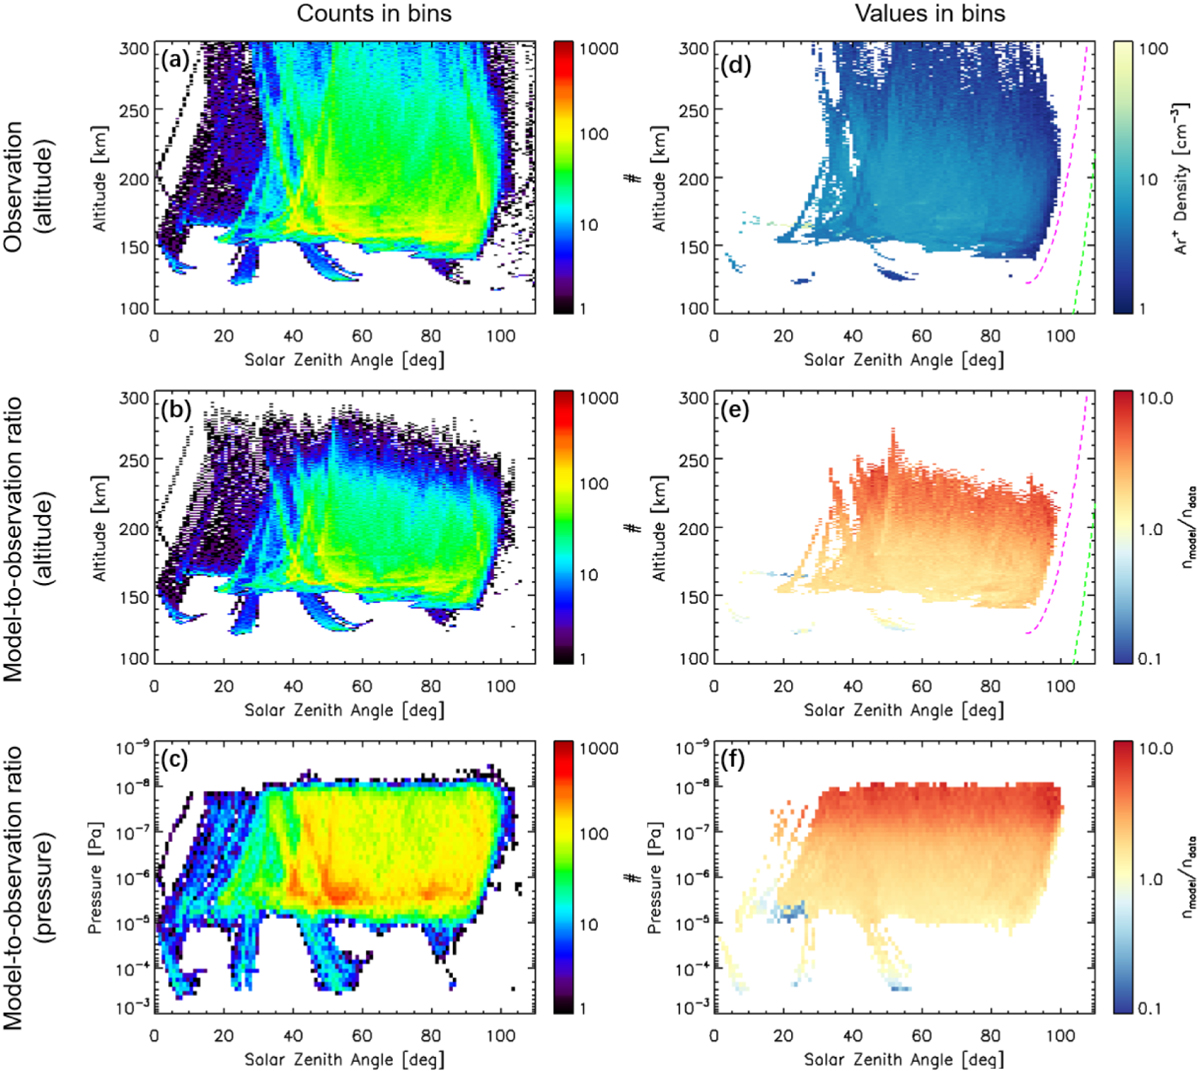
Distribution of observed and modeled Ar+densities and model-to-observation density ratio, excluding data points where the observed Ar+ density is less than 1 cm−3. The upper, middle, and lower panels represent the observations, model results, and model-to-observation density ratio, respectively. The color in the left panels (a, b, and c) indicates the number of data points in each bin, while the color in the middle panels (d, e, and f) represents the values of Ar+density or model-to-observation density ratio. The green and magenta dashed lines denote the optical and EUV terminators, assuming altitudes at the Martian surface and 122.5 km, respectively, on the dayside.
Current usage metrics show cumulative count of Article Views (full-text article views including HTML views, PDF and ePub downloads, according to the available data) and Abstracts Views on Vision4Press platform.
Data correspond to usage on the plateform after 2015. The current usage metrics is available 48-96 hours after online publication and is updated daily on week days.
Initial download of the metrics may take a while.