| Issue |
A&A
Volume 701, September 2025
|
|
|---|---|---|
| Article Number | A293 | |
| Number of page(s) | 7 | |
| Section | Planets, planetary systems, and small bodies | |
| DOI | https://doi.org/10.1051/0004-6361/202555806 | |
| Published online | 26 September 2025 | |
Photochemical modeling of Ar+ ions in the Martian dayside ionosphere: Implications for ionospheric modeling on Mars
1
Swedish Institute of Space Physics,
Uppsala,
Sweden
2
Space Sciences Laboratory, University of California,
Berkeley, Berkeley, CA,
USA
★ Corresponding author: This email address is being protected from spambots. You need JavaScript enabled to view it.
Received:
4
June
2025
Accepted:
18
August
2025
Abstract
The Martian dayside ionosphere has been widely modeled using photochemical equilibrium calculations. These efforts have mostly focused on dominant ion species in order to make comparisons with orbital observations and on displaying non-negligible model-observation discrepancies. In this study, we investigate Ar+ions in the Martian dayside ionosphere, an ion species with a relatively simple chemistry, and perform both case-by-case orbital comparisons and a statistical comparison over five years of observations by the Neutral Gas and Ion Mass Spectrometer (NGIMS) on the Mars Atmosphere and Volatile Evolution (MAVEN) mission. Statistically, the ratio of modeled to observed Ar+densities increases from ∼1 near 130 km to ∼4 at 220 km, with notable variations as a function of the solar zenith angle. Pressure-dependent discrepancies show a weaker correlation with the solar zenith angle. Model performance improves when incorporating (i) a higher reaction rate coefficient for the charge transfer between Ar+and CO2 and/or (ii) reduced solar irradiance. At altitudes above 200 km, Ar+loss via reactions with H2 becomes increasingly important. However, we find that model-observation agreement varies between orbits: Some show strong consistency, particularly during Deep Dip campaigns, while others exhibit systematic deviations or significant discrepancies. We suggest that while systematic adjustments to reaction rate coefficients, ionization cross sections, solar irradiance, or background neutral densities may improve model fidelity for certain orbits, capturing the dynamic and time-varying nature of the Martian ionosphere requires further comprehensive investigations.
Key words: astrochemistry / planets and satellites: atmospheres
© The Authors 2025
 Open Access article, published by EDP Sciences, under the terms of the Creative Commons Attribution License (https://creativecommons.org/licenses/by/4.0), which permits unrestricted use, distribution, and reproduction in any medium, provided the original work is properly cited.
This article is published in open access under the Subscribe to Open model. This email address is being protected from spambots. You need JavaScript enabled to view it. to support open access publication.
1 Introduction
Mars provides a unique laboratory for photochemical modeling thanks to its thin CO2-dominated atmosphere interacting with extreme ultraviolet (EUV) solar radiation and the solar wind. The structure of the Martian ionosphere generally adheres to photochemical equilibrium (PCE) below 200 km, where the production of ionospheric plasma is closely balanced by its destruction through recombination (e.g., González-Galindo et al. 2013). The Mars Atmosphere and Volatile Evolution (MAVEN) mission (Jakosky et al. 2015) has provided extensive datasets on the abundance of ion and neutral species, electron density and temperature, solar irradiance, and electron flux (Andersson et al. 2015; Eparvier et al. 2015; Mahaffy et al. 2015b; Mitchell et al. 2016). The mission's observations have enabled the refinement of photochemical models and their comparison to observations, including for abundant key ion species such as  , and
, and  (Withers 2023, and references therein) and for more exotic species such as the doubly charged ion
  (Gu et al. 2020; Cheng et al. 2025). The present work focuses on model-observation comparisons of Ar+.
Argon plays a critical role in our understanding of the atmospheric evolution of Mars. Isotopic ratios, particularly the ratio of 38 Ar to 36 Ar, have been used as a tracer of atmospheric escape processes over geological timescales (Jakosky et al. 2017). As another application, the vertical density profile of Ar has been used to derive the kinetic temperature of the neutral gas in Mars' upper atmosphere (Bougher et al. 2017; Stone et al. 2018). However, due to it being inert and a minor component of the upper atmosphere, Ar has received limited attention in photochemical modeling studies. For example, Ar, Ar+, and ArH+were included in the photochemical models of Krasnopolsky (2002); Matta et al. (2013); Fox et al. (2015, 2021); Wu et al. (2021), but direct comparisons between modeled and observed Ar+density are few.
A detailed model-observation comparison of Ar+concentrations may provide clues on the underlying causes for the discrepancies between observations and results from photochemical models of the Martian dayside ionosphere. While there are many studies presenting model-observation comparisons of the key ion species  , and O+measured by the Neutral Gas and Ion Mass Spectrometer (NGIMS) on MAVEN (Mahaffy et al. 2015a), Withers (2023) highlighted that most of these studies have revealed difficulties in accurately reproducing observed ion density profiles. This has forced modelers to consider ad hoc adjustments of the model input such as the use of i) NGIMS derived O concentrations modified by various constant factors (e.g., Fox et al. 2021; Wu et al. 2021), ii) reduced electron temperatures (e.g., Vigren & Cui 2019; Mukundan et al. 2020) in comparison to measurements by the Langmuir Probe and Waves instrument (Andersson et al. 2015; Ergun et al. 2015), iii) reduced solar EUV fluxes in comparison to available spectra (Wu et al. 2021; Hensley et al. 2022; Persson & Vigren 2024), or iv) pressure-dependent reaction rate coefficients (Persson & Vigren 2024). In comparison, the modeled density of Ar+is influenced only by a subset of the listed ad hoc adjustment, as discussed below.
Targeting the noble gas ion Ar+is beneficial for at least two reasons. First, as Ar+is an atomic ion, its primary loss mechanism is charge transfer with CO2 rather than electron recombination. Because the radiative recombination rate is extremely low, the loss rate calculations are largely independent of electron temperature assumptions. Since previous studies (Vigren & Cui 2019; Mukundan et al. 2020) have suggested that discrepancies in model calculations could be linked to uncertainties in Langmuir Probe and Waves-measured electron temperatures, this property of Ar+helps eliminate the influence of that specific issue. Second, electron transfer from Ar to the dominant ions in the Martian ionosphere ( ) is energetically prohibited. The production rate of Ar+is thus decoupled from complex ion-neutral chemistry and essentially dictated only by the photoionization (PI) and electron-impact ionization (EI) of Ar. Moreover, the charge transfers between Ar+and O is characterized by a very low rate constant (Gaucherel & Rowe 1977) and should play a minor role for the removal of Ar+even in a scenario where the abundance of O is a factor of a few higher than suggested by the publicly available NGIMS datasets.
This work proceeds as follows. In Section 2, we describe the photochemical model used to calculate the number density of Ar+under the assumption of PCE. In Section 3, we compare modeled and observed Ar+densities, focusing first on individual orbits associated with MAVEN Deep Dip (DD) campaigns, then on the full dataset at hand. We present the model-to-observation density ratio both as a function of altitude and as a function of pressure. We explore circumstances where the level of agreement is better than on average and investigate the sensitivity of modeled Ar+densities to changes in the model input parameters. Section 4 provides a general discussion, and Section 5 presents a summary and our concluding remarks.
Chemical loss channels of Ar+and the respective rate coefficients.
2 Method and data
As discussed in Section 1, we considered Ar+production through PI and EI of Ar. We accounted for the Ar+loss via reactions with CO2, CO, N2, O, and H2. Assuming PCE, we derived the Ar+density in the dayside ionosphere of Mars by using the formula
 (1)
where PIFAr and EIFAr are the PI and EI frequencies of Ar in units of s−1, nAr is the number density of Ar, ni is the number density of neutral species i (including CO2, CO, N2, O, and H2), and ki is the reaction rate coefficient between Ar+and neutral species i. The rate coefficients used in this study are listed in Table 1.
(1)
where PIFAr and EIFAr are the PI and EI frequencies of Ar in units of s−1, nAr is the number density of Ar, ni is the number density of neutral species i (including CO2, CO, N2, O, and H2), and ki is the reaction rate coefficient between Ar+and neutral species i. The rate coefficients used in this study are listed in Table 1.
The values of PIFAr and EIFAr were taken directly from the work of Lillis et al. (2021), deposited at a FAIR-compliant Dryad database (Lillis 2021) spanning from 2014 to 2019. In brief, the PIFAr was derived from
 (2)
where λ is wavelength, σPI,Ar is the PI cross section of Ar, and Fp is the attenuated solar photon flux. In addition, EIFAr was calculated by Lillis et al. (2021) through
(2)
where λ is wavelength, σPI,Ar is the PI cross section of Ar, and Fp is the attenuated solar photon flux. In addition, EIFAr was calculated by Lillis et al. (2021) through
 (3)
where E is energy, σEI,Ar is the cross section for the EI of Ar, and Fe is the differential electron number flux measured by the MAVEN Solar Wind Electron Analyzer (SWEA) (Mitchell et al. 2016). Further details on the underlying datasets can be found in Lillis et al. (2021).
(3)
where E is energy, σEI,Ar is the cross section for the EI of Ar, and Fe is the differential electron number flux measured by the MAVEN Solar Wind Electron Analyzer (SWEA) (Mitchell et al. 2016). Further details on the underlying datasets can be found in Lillis et al. (2021).
3 Results
3.1 Case-by-case orbital comparison
We first focus on MAVEN DD orbits with a periapsis altitude of around 120−130 km, providing access to the deeper ionosphere, compared to a periapsis altitude of ∼150 km during nominal orbits (Bougher et al. 2015). Fig. 1 presents the model inputs and outputs for orbit #1085 during DD2 as an example, with other orbits for the same campaign showing similar results. Panel a displays the neutral densities, including Ar for calculating Ar+production rates and CO2, CO, N2, O, and H2 for calculating Ar+loss rates. Panel b shows the production (solid lines) and loss rates (dashed lines). Panel c compares Ar+densities from NGIMS observations (black dots) and the model (red lines).
Typically, the dominant neutral species below 180 km is CO2, while H2 is a minor species (Fig. 1a). Despite a lower H2 abundance, its relatively high reaction rate coefficient (Table 1) contributes significantly to Ar+loss rates at altitudes above ∼220 km, becoming comparable to CO2 and CO (Fig. 1b). PI is the primary Ar+production mechanism, with EI contributing ∼40% of the total PI rate (Fig. 1b) and varying with altitude, similar to results from Lillis et al. (2021). Model results of Ar+densities show good agreement with NGIMS observations at altitudes below 250 km for orbit #1085 (Fig. 1c), considering observational and modeling uncertainties. For NGIMS-measured Ar+ density data, we considered an uncertainty of 25% (Benna et al. 2015). The uncertainties in the model include a 20% uncertainty in the PI cross sections, a 20% uncertainty in solar irradiance, a 5% uncertainty in the electron impact cross sections, and a 25% uncertainty in SWEA-measured suprathermal electron fluxes (Lillis et al. 2021). Additionally, we considered a maximum Ar++CO2 rate coefficient of 7.6 × 10⁻¹⁰ cm3 s−1 and a minimum value of 4.4 × 10⁻¹⁰ cm3 s−1 (Fehsenfeld et al. 1966; Anicich & Huntress 1986). The uncertainties in the NGIMS neutral densities for major species were estimated to be less than 20% but are significantly lower for mixing ratios (Mahaffy et al. 2015a), as applied in Eq. (1).
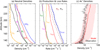 |
Fig. 1 Example of photochemical modeling for orbit #1085 (during DD2). Panel a displays the neutral densities used as inputs for the modeling. Panel b presents the production and loss rates of Ar+from the model. Panel c shows Ar+densities from the model and observations. |
3.2 Statistical comparisons
We extended the modeling of Ar+densities using NGIMS data from 2014 to 2019, employing the PIF and EIF datasets provided by Lillis et al. (2021). Fig. 2 presents statistical comparisons of observed and modeled Ar+densities. Figs. 2a and d display NGIMS measurements of Ar+, binned by altitude and solar zenith angle (SZA). Fig. 2a illustrates the number of data points in each bin, with a resolution of 1 km in altitude and 1 degree in SZA, where bins typically contain 10-100 data points. Fig. 2d shows the median Ar+density within each bin, excluding bins with fewer than ten data points to ensure statistical reliability. The green and magenta dashed lines denote the locations of the optical and EUV terminators in the nightside, respectively, assuming that the optical and EUV terminators correspond to the Martian surface and an altitude of 122.5 km on the day-side. Fig. 2e depicts the model-to-observation density ratio of Ar+as a function of altitude and SZA, while Fig. 2f shows the ratios as a function of atmospheric pressure and SZA, using the pressure dataset from Lillis et al. (2021). In Figs. 2e and f, red indicates overestimation, and blue indicates underestimation of the model results relative to NGIMS observations. It is important to note that data points with an observed Ar+density of less than 1 cm−3 were excluded from the statistical analysis, where the uncertainties may be high.
The model consistently overestimates Ar+densities above 150 km (Fig. 2e). The overestimation increases with altitude but varies depending on SZA. Discrepancies also grow with decreasing pressure (as it corresponds to higher altitudes) and exhibit a more stratified distribution in the pressure profile than the altitude profile (Fig. 2f).
To further analyze these discrepancies, we examined the altitude and pressure histograms of the model-to-observation density ratio, as shown in Fig. 3. We show the probability distribution of the model-to-observation density ratio at each altitude or pressure bin range, with the color indicating the ratio of data point counts within each bin to the total counts in the corresponding vertical range, with the median ratio for each range marked by black lines. Between 120 and 150 km in altitude (Fig. 2a), and for pressures ranging from 10−5 and a few times 10−4 Pa (Fig. 3b), the model-to-observation density ratio is close to unity, indicating good agreement between modeled and observed Ar+densities. At higher altitudes (corresponding to lower pressures), however, discrepancies become more pronounced.
The dispersed pattern at high altitudes and the concentrated pattern at low pressure levels reflect a more stratified distribution of atmospheric pressures. This is due to the behavior of PI and EI rates primarily being driven by (a) the neutral density and (b) the attenuation of solar photon flux (the latter depends on the total mass of absorbing material along the photon's path), the uncertainty of which increases with SZA due to the unavoidable assumption of spherical symmetry in altitude density profiles made by Lillis et al. (2021). However, since data-model agreement is good at altitudes (<150km) where this attenuation matters most, the larger discrepancy at high altitudes is attributed mostly to ion transport processes, which violate the PCE assumption underlying the model.
3.2.1 Effects of rate coefficients
As shown in Fig. 1b, the destruction of Ar+is primarily driven by its reactions with CO2, due to its high abundance (Fig. 1a) and large rate coefficient among the considered species: CO2, CO, O, N2, and H2 (Table 1). The reported rate coefficient for the reaction between Ar+and CO2 varies across experimental studies. In this work, we used the rate coefficient of 7.6 × 10⁻¹⁰ cm3 s−1 proposed by Fehsenfeld et al. (1966), which is approximately 50% higher than the value of 5 × 10⁻¹⁰ cm3 s−1 proposed by Dotan et al. (1999).
We performed modeling using the lower rate coefficient of 5 × 10⁻¹⁰ cm3 s−1, with the resulting Ar+densities shown in Fig. 4 (dashed green lines in panels a and b). Using the lower coefficient, the model-to-observation density ratio increases from two to three at 180 km and from four to five at 250 km, compared to results obtained with the higher rate coefficient. While this may indicate that the rate coefficient of 7.6 × 10⁻¹⁰ cm3 s−1 is more appropriate for accurately modeling the destruction of Ar+ by CO2 in the Martian dayside ionosphere, it cannot be ruled out that this is coincidental and caused by other errors in the model input.
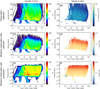 |
Fig. 2 Distribution of observed and modeled Ar+densities and model-to-observation density ratio, excluding data points where the observed Ar+ density is less than 1 cm−3. The upper, middle, and lower panels represent the observations, model results, and model-to-observation density ratio, respectively. The color in the left panels (a, b, and c) indicates the number of data points in each bin, while the color in the middle panels (d, e, and f) represents the values of Ar+density or model-to-observation density ratio. The green and magenta dashed lines denote the optical and EUV terminators, assuming altitudes at the Martian surface and 122.5 km, respectively, on the dayside. |
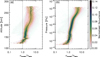 |
Fig. 3 Altitude (a) and pressure (b) profiles of the Ar+model-to-observation density ratio. The color represents the probability distribution in each vertical bin, while the solid line indicates the median value within each vertical bin. |
3.2.2 Effects of solar irradiance
As the main production mechanism for Ar+is the PI of Ar, a reduction in the utilized solar EUV spectrum naturally results in a decrease of the modeled Ar+density and thus smaller model-to-observation density ratios. As noted in Section 1, earlier studies focusing on the total ion number density and/or the number density of key ion species in the Martian ionosphere have at least mentioned substantial reductions in the utilized solar EUV spectra as a means of improving the level of agreement between models and observations. Persson & Vigren (2024) empirically found that a reduction of at least 50% in the EUV spectra was needed to bring calculated electron production rates into agreement with calculated electron loss rates. Wu et al. (2021) reported a general problem of their ionosphere model overestimating the total ion number density by ∼50%. In response to this, Withers (2023) noted that if the problem was solely due to errors in the EUV spectra, the latter would have needed to be corrected by a factor of ∼2.25.
The effect on the modeled Ar+density of utilizing 50% lower PIF Ar values is illustrated in Fig. 4 (the gray lines in panels a and b). It can be seen that the model-to-observation density ratios come close to unity for altitudes between 140 and 170 km. If we use as the default the rate coefficient of Dotan et al. (1999) for the reaction between Ar+and CO2, an even more pronounced reduction of PIFAr is needed to force the modeled Ar+into close agreement with the observations (see the dashed gray lines in panels a and b). With that said, it has been noted that other parameters can also be tuned to obtain better model-observation agreement. Moreover, and equally important, the estimated uncertainty in the utilized PIF Ar values is only 28% despite encapsulating more than just the uncertainties in the solar EUV spectral irradiance (see Lillis et al. 2021, and references therein).
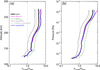 |
Fig. 4 Altitude (a) and pressure (b) profiles of the Ar+model-to-observation density ratio under different input conditions. Results with H2 excluded (magenta lines), a lower rate coefficient for the Ar++CO2 reaction (dashed green lines), a 50% reduction in solar irradiance (gray lines), and a combination of the lower rate coefficient, reduced solar irradiance (dashed gray lines), and a reduction of CO densities by an order of 6.5 are shown in each panel. |
3.2.3 Effects of background H2 and CO
While CO2 is the dominant neutral species and the primary loss channel for Ar+, CO serves as a secondary loss pathway. In addition, though H2 is less abundant, it acts as a minor but non-negligible contributor due to the relatively high rate coefficient for the Ar++H2 reaction.
To assess the influence of H2, we compared modeled Ar+ densities with and without consideration of H2 (magenta lines in Figure 4). At altitudes below 200 km and pressure above 10−7 Pa, the effect of H2 is negligible, as its density and corresponding loss rate are much lower than that of CO2 and CO (Figs. 1a and b). However, at higher altitudes and lower pressures, incorporating H2 reduces the discrepancy between model predictions and observations. At these levels, the loss rate via H2 is comparable to that of CO2 and CO (Fig. 1b), emphasizing the importance of including H2 for more accurate modeling at altitudes above 200 km.
In addition, CO densities measured by NGIMS have been suggested to be overestimated by a factor of ∼6.5 (Wu et al. 2020, 2021). To examine the impact of this overestimation, we conducted a sensitivity test by reducing the CO density by this factor (blue lines in Fig. 4). As with H2, the influence of CO is negligible below 200 km, where Ar+loss is dominated by reactions with CO2. However, at higher altitudes, the contributions of CO and H2 to Ar+loss increase, and adjusting their densities has a strong influence on the modeled results. Specifically, neglecting H2 and reducing CO densities by a factor of 6.5 results in an increase in the modeled Ar+density and raises the model-to-observation ratio from approximately four to six at altitudes near 250 km.
4 Discussion
As discussed in Section 3.2, adjustments in the rate coefficient for the Ar++CO2 reaction, the solar irradiance, or densities of background H2 and CO can systematically affect the PCE modeling of Ar+. Specifically, reducing the solar irradiance leads to significantly better agreement between the model and the observation at altitudes between 140 km and 180 km. Moreover, adopting a higher Ar++CO2 rate coefficient substantially improves the overall model performance, and Ar+loss via H2 and CO becomes comparable to that via CO2 above 200 km.
However, model-observation discrepancies are noticeably altitude dependent. At altitudes above 200 km, the PCE model consistently overestimates Ar+densities, which is likely due to the neglect of ion transport processes. At these altitudes, photochemical production results in a steep upward Ar+density gradient, leading to a downward diffusive flux that is not captured by the PCE framework. This behavior is consistent with the known dynamics of other ion species, such as O+in the Martian ionosphere (e.g., Chaufray et al. 2014), which would act to reduce the ion density and potentially improve model-observation agreement in this region (Fig. 1 in Chaufray et al. 2014).
Below 140 km, the PCE model generally tends to underestimate Ar+densities, although the discrepancy is more variable between orbits. In some cases, the model shows a slight underestimation (e.g., orbit #1085 in Fig. 1c), while in others it shows a slight overestimation (e.g., orbit #1063 in Fig. 5), or it shows good agreement (e.g., orbits #1837 and #6973 in Fig. 5). In this lower region of the ionosphere, EI becomes comparable to, and even more significant than, PI in producing Ar+. Therefore, the accuracy of SWEA-measured electron fluxes plays a critical role in modeling results. Considering the 25% uncertainties in differential electron number fluxes, along with additional uncertainties in parameters such as ionization cross sections and solar irradiance, the model-observation differences at these lower altitudes are within reasonable bounds (Figs. 5a and b) and may not be significant.
Additionally, while similar simple adjustments to parameters such as ionization cross sections or NGIMS-measured neutral densities by certain factors may also systematically improve model-observation agreement, they do not guarantee consistent improvement for all orbits and may even worsen the agreement for others orbits. For example, orbits such as #1063 (DD2) and #6973 (DD9) show strong agreement over the entire observed altitude range (130-220 km; Fig. 5a). In contrast, orbits such as #1837 (DD4) and #5615 (DD7) show deviations above 200 km, suggesting the influence of non-photochemical processes (Fig. 5b). For orbits such as #8978 and #2271, a systematic overestimation of Ar+densities by the model may indicate an overestimation of background neutral densities, potentially by a factor of 1.5−3 (Fig. 5c). Finally, for orbits such as #1127 and #4242, the model fails to reproduce the observed profile entirely, underestimating Ar+below 200 km and overestimating it above, with trends opposite to those observed (Fig. 5d). These examples illustrate that simple parameter adjustments by certain factors (e.g., modifying reaction rate coefficients, solar irradiance, ionization cross sections, or background densities) may improve model-observation agreement in specific cases (such as Fig. 5c) but are not universally applicable and may degrade model performance in other scenarios.
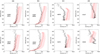 |
Fig. 5 Sample comparisons between modeled and observed Ar+densities along selected MAVEN orbits. |
5 Conclusions
In this study, we have modeled Ar+densities in the dayside ionosphere of Mars using the PCE assumption. We considered Ar+production through the PI and EI of Ar and its destruction through reactions with CO2, CO, O, N2, and H2. Input densities for CO2, CO, O, and N2 were from NGIMS Level 2 data, while H2 densities were derived from NGIMS Level 1B data. We utilized the PI and EI frequency dataset from Lillis (2021) covering five years of NGMIS observations (2014-2019) to predict Ar+ densities and for comparison with NGIMS measurements.
Our results demonstrate good agreement between modeled Ar+densities and NGIMS observations for some orbits, especially those during DD campaigns and at altitudes below 200 km. Statistically, over five years of data, the model-observation discrepancy was larger at higher altitudes, though it varied with SZA, while the pressure-dependent discrepancy exhibited less correlation with SZA. At an altitude of 120 km, the model-to-observation density ratio for Ar+density was close to unity near 130 km, increasing to ∼4 at 250 km, but the pressure dependence shows a clearer trend, with the ratio increasing from close to unity at 10−4 Pa to a factor of approximately five at 10−8 Pa. The larger model-observation discrepancy at altitudes above 200 km is likely due to ion transport processes, emphasizing the need for future studies using models that incorporate both photochemistry and transport dynamics, such as the ambipolar diffusion and a downward flux under the influence of a large upward density gradient.
The possible use of Mars' ionosphere as a natural laboratory to estimate or test reported rate coefficients of ion-neutral reactions has been highlighted before. In recent times, there has been an emphasis on studying the interaction between  and atomic oxygen, O (Fox et al. 2017, 2021; Persson & Vigren 2024), for which results from experimental studies by Fehsenfeld et al. (1970) and Tenewitz et al. (2018) are dramatically different. For our modeling of the Ar+balance in the dayside ionosphere of Mars, the ion-neutral reaction of most importance is the charge transfer reaction between Ar+and CO2. When comparing the results from modeling with a rate coefficient between Ar+and CO2 of 7.6 × 10⁻¹⁰ and 5 × 10⁻¹⁰ cm3 s−1 (Fehsenfeld et al. 1966; Dotan et al. 1999), we found that the use of the higher rate coefficient renders a better model-observation agreement of Ar+number density in the Martian dayside ionosphere. A ∼50% higher CO2 rate coefficient reduces the model-to-observation density ratio from three (using the lower rate coefficient) to two at altitudes near 180 km. The matching relative change can be understood from Eq. (1) given that the loss of Ar+is very much dominated by its reaction with CO2 for altitudes well below 200 km.
We also examined the effects of input solar irradiance and background H2 and CO on Ar+modeling. With a 50% reduction in solar irradiance, the model-to-observation density ratio decreases, approaching unity at altitudes between 140 and 170 km. For results based on the lower CO2 reaction rate from Dotan et al. (1999), an even greater reduction in solar irradiance would be required to achieve a perfect model-observation agreement. For H2, although it is a minor species at altitudes below 200 km in the Martian dayside ionosphere, its increased relative abundance at higher altitudes, combined with its relatively high reaction rate with Ar+, makes it significant. Neglecting H2 in the PCE model increases the modeled Ar+density, raising the model-to-observation ratio from approximately four to six at altitudes around 250 km. Similarly, reducing CO densities by a factor of 6.5, as suggested by Wu et al. (2020, 2021), yields a comparable effect.
While typical adjustments in model input parameters by certain factors, such as reaction rate coefficients, solar irradiance, and background neutral densities, can improve model-observation agreement for certain orbits, they do not consistently yield better results across all cases. Capturing the dynamic and time-varying nature of the Martian ionosphere will require further comprehensive investigations.
Acknowledgements
We are grateful for the support from the Swedish National Space Agency (Dnr 2022-00201). The MAVEN NGIMS L1B (version 9) and L2 (version 8) data used in this study is publicly available at NASA's Planetary Data System (https://atmos.nmsu.edu/data_and_services/atmospheres_data/MAVEN/ngims.html).
References
- Andersson, L., Ergun, R. E., Delory, G. T., et al. 2015, SSRv, 195, 173 [Google Scholar]
- Anicich, V. G., & Huntress, W. T., J. 1986, ApJS, 62, 553 [NASA ADS] [CrossRef] [Google Scholar]
- Benna, M., Mahaffy, P. R., Grebowsky, J. M., et al. 2015, GRL, 42, 8958 [Google Scholar]
- Bougher, S., Jakosky, B., Halekas, J., et al. 2015, Science, 350, aad0459 [Google Scholar]
- Bougher, S. W., Roeten, K. J., Olsen, K., et al. 2017, JGRA, 122, 1296 [Google Scholar]
- Chaufray, J. Y., Gonzalez-Galindo, F., Forget, F., et al. 2014, JGRE, 119, 1614 [NASA ADS] [Google Scholar]
- Cheng, L., Vigren, E., Persson, M., Gu, H., & Cui, J. 2025, ApJ, 979, 52 [Google Scholar]
- Dotan, I., Midey, A. J., & Viggiano, A. A. 1999, JASMS, 10, 815 [Google Scholar]
- Eparvier, F. G., Chamberlin, P. C., Woods, T. N., & Thiemann, E. M., 2015, SSRv, 195, 293 [Google Scholar]
- Ergun, R. E., Morooka, M. W., Andersson, L. A., et al. 2015, GRL, 42, 8846 [Google Scholar]
- Fehsenfeld, F. C., Ferguson, E. E., & Schmeltekopf, A. L., 1966, JChPh, 45, 404 [Google Scholar]
- Fehsenfeld, F. C., Dunkin, D. B., & Ferguson, E. E., 1970, P&SS, 18, 1267 [Google Scholar]
- Fox, J. L., Benna, M., Mahaffy, P. R., & Jakosky, B. M., 2015, GRL, 42, 8977 [Google Scholar]
- Fox, J. L., Johnson, A. S., Ard, S. G., Shuman, N. S., & Viggiano, A. A., 2017, GRL, 44, 8099 [Google Scholar]
- Fox, J. L., Benna, M., McFadden, J. P., & Jakosky, B. M., 2021, Icar, 358, 114186 [Google Scholar]
- Gaucherel, P., & Rowe, B., 1977, IJMIP, 25, 211 [Google Scholar]
- González-Galindo, F., Chaufray, J. Y., Lõpez-Valverde, M. A., et al. 2013, JGRE, 118, 2105 [Google Scholar]
- Gu, H., Cui, J., Niu, D. D., et al. 2020, E&PP, 4, 396 [Google Scholar]
- Hensley, K., Withers, P., & Thiemann, E., 2022, JGRA, 127, e2022JA030998 [Google Scholar]
- Jakosky, B. M., Lin, R. P., Grebowsky, J. M., et al. 2015, SSRv, 195, 3 [Google Scholar]
- Jakosky, B. M., Slipski, M., Benna, M., et al. 2017, Science, 355, 1408 [CrossRef] [Google Scholar]
- Krasnopolsky, V. A., 2002, JGRE, 107, 11 [Google Scholar]
- Lillis, R. J., 2021, Photoionization and electron impact ionization frequencies in the dayside ionosphere of Mars, calculated from MAVEN in situ data [Google Scholar]
- Lillis, R. J., Xu, S., Mitchell, D., et al. 2021, JGRE, 126, e2021JE006923 [Google Scholar]
- Mahaffy, P. R., Benna, M., Elrod, M., et al. 2015a, GRL, 42, 8951 [Google Scholar]
- Mahaffy, P. R., Benna, M., King, T., et al. 2015b, SSRv, 195, 49 [Google Scholar]
- Matta, M., Withers, P., & Mendillo, M., 2013, JGRA, 118, 2681 [Google Scholar]
- Mitchell, D. L., Mazelle, C., Sauvaud, J. A., et al. 2016, SSRv, 200, 495 [Google Scholar]
- Mukundan, V., Thampi, S. V., Bhardwaj, A., & Krishnaprasad, C., 2020, Icar, 337, 113502 [Google Scholar]
- Persson, M., & Vigren, E., 2024, ApJ, 970, 125 [Google Scholar]
- Stone, S. W., Yelle, R. V., Benna, M., Elrod, M. K., & Mahaffy, P. R., 2018, JGRE, 123, 2842 [Google Scholar]
- Tenewitz, J. E., Lê, T., Martinez, O., et al. 2018, JChPh, 148, 084305 [Google Scholar]
- Vigren, E., & Cui, J., 2019, ApJ, 887, 177 [Google Scholar]
- Withers, P., 2023, JGRA, 128, e2022JA031227 [Google Scholar]
- Wu, X., Cui, J., Yelle, R., et al. 2020, JGRE, 125, e2020JE006441 [Google Scholar]
- Wu, X., Cui, J., Niu, D., Ren, Z., & Wei, Y., 2021, ApJ, 923, 29 [NASA ADS] [CrossRef] [Google Scholar]
All Tables
All Figures
|
Fig. 1 Example of photochemical modeling for orbit #1085 (during DD2). Panel a displays the neutral densities used as inputs for the modeling. Panel b presents the production and loss rates of Ar+from the model. Panel c shows Ar+densities from the model and observations. |
| In the text | |
|
Fig. 2 Distribution of observed and modeled Ar+densities and model-to-observation density ratio, excluding data points where the observed Ar+ density is less than 1 cm−3. The upper, middle, and lower panels represent the observations, model results, and model-to-observation density ratio, respectively. The color in the left panels (a, b, and c) indicates the number of data points in each bin, while the color in the middle panels (d, e, and f) represents the values of Ar+density or model-to-observation density ratio. The green and magenta dashed lines denote the optical and EUV terminators, assuming altitudes at the Martian surface and 122.5 km, respectively, on the dayside. |
| In the text | |
|
Fig. 3 Altitude (a) and pressure (b) profiles of the Ar+model-to-observation density ratio. The color represents the probability distribution in each vertical bin, while the solid line indicates the median value within each vertical bin. |
| In the text | |
|
Fig. 4 Altitude (a) and pressure (b) profiles of the Ar+model-to-observation density ratio under different input conditions. Results with H2 excluded (magenta lines), a lower rate coefficient for the Ar++CO2 reaction (dashed green lines), a 50% reduction in solar irradiance (gray lines), and a combination of the lower rate coefficient, reduced solar irradiance (dashed gray lines), and a reduction of CO densities by an order of 6.5 are shown in each panel. |
| In the text | |
|
Fig. 5 Sample comparisons between modeled and observed Ar+densities along selected MAVEN orbits. |
| In the text | |
Current usage metrics show cumulative count of Article Views (full-text article views including HTML views, PDF and ePub downloads, according to the available data) and Abstracts Views on Vision4Press platform.
Data correspond to usage on the plateform after 2015. The current usage metrics is available 48-96 hours after online publication and is updated daily on week days.
Initial download of the metrics may take a while.