Open Access
Fig. 2.
Download original image
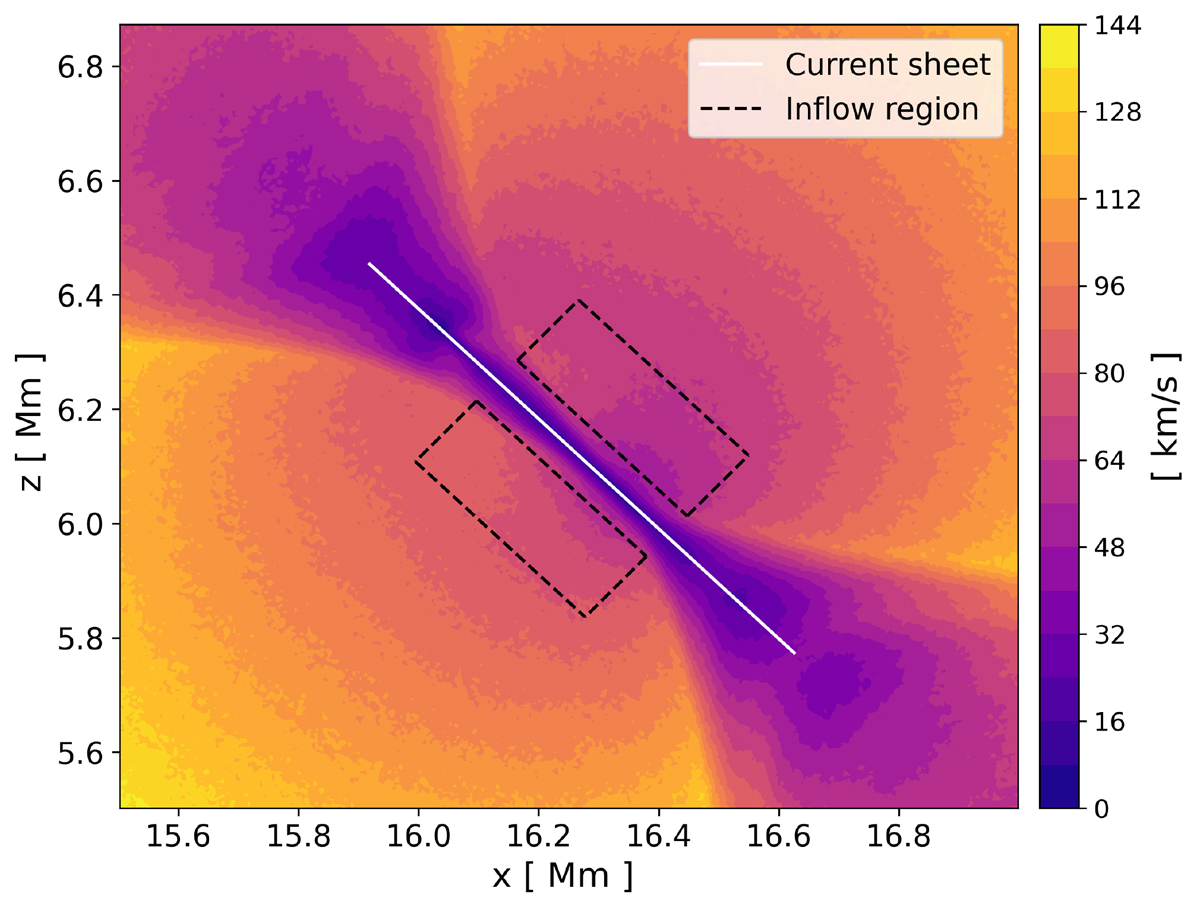
Alfvén velocity in the b_r2_e0_m25 run, 10 s after restart. The dashed region indicates the area used for inflow analysis. The white line traces the current sheet and defines the axis for computing perpendicular velocity components.
Current usage metrics show cumulative count of Article Views (full-text article views including HTML views, PDF and ePub downloads, according to the available data) and Abstracts Views on Vision4Press platform.
Data correspond to usage on the plateform after 2015. The current usage metrics is available 48-96 hours after online publication and is updated daily on week days.
Initial download of the metrics may take a while.