Open Access
Fig. 3.
Download original image
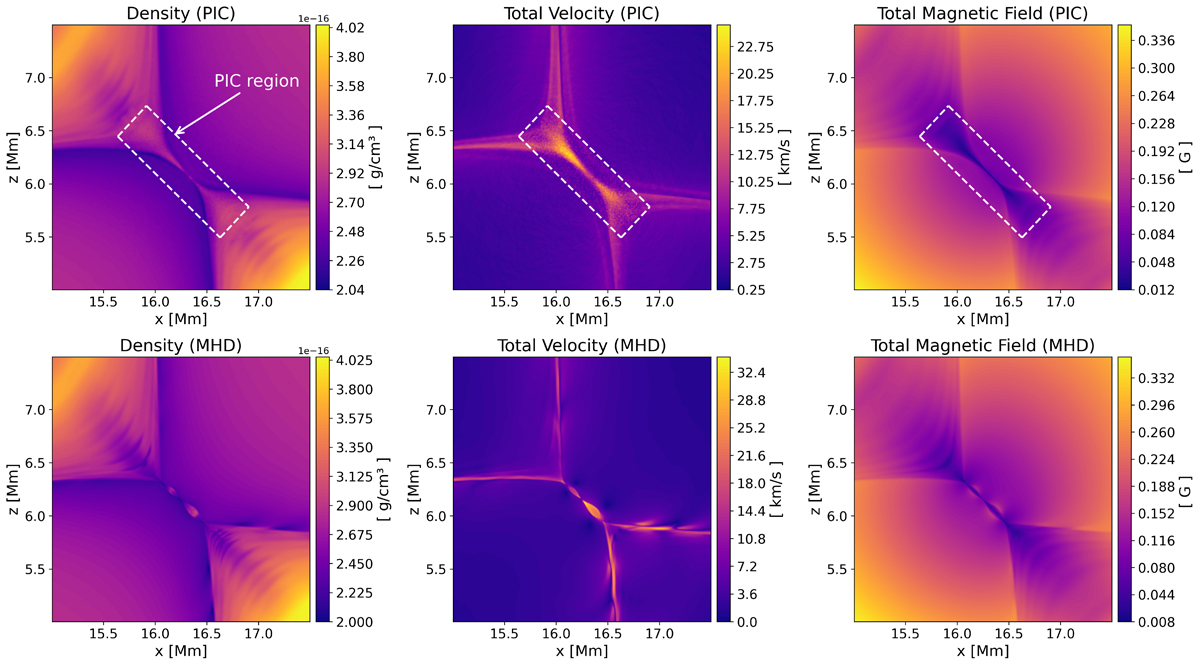
Comparison between the s_r3_e1_m25 PIC run and the high-resolution 8K MHD simulation 35 s after restart. The dashed white outline indicates the PIC region. In the MHD case, a prominent plasmoid is visible in both the density and velocity fields.
Current usage metrics show cumulative count of Article Views (full-text article views including HTML views, PDF and ePub downloads, according to the available data) and Abstracts Views on Vision4Press platform.
Data correspond to usage on the plateform after 2015. The current usage metrics is available 48-96 hours after online publication and is updated daily on week days.
Initial download of the metrics may take a while.