Open Access
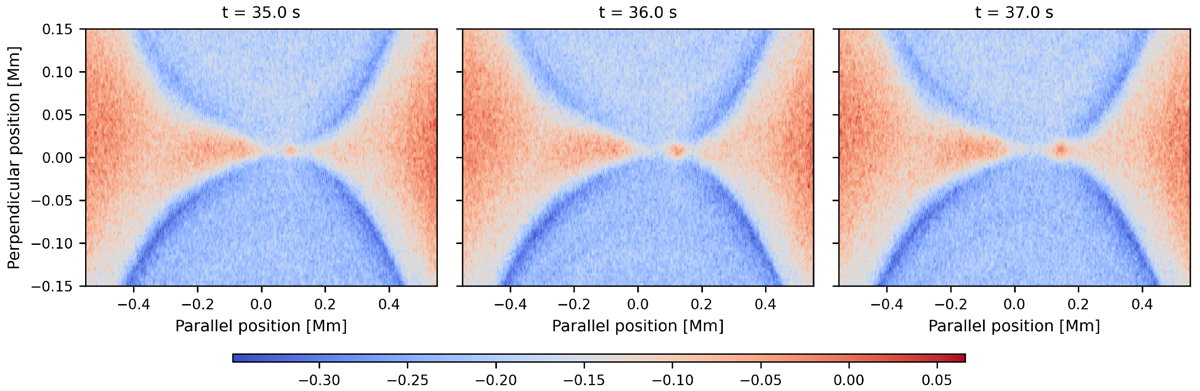
Fig. 7.
Download original image
Secondary plasmoid formation in the s_r3_e1_m25 simulation, shown as relative density compared to ρ0. The event occurs around 35 s after restart, within the elongated current sheet produced by this PAC configuration.
Current usage metrics show cumulative count of Article Views (full-text article views including HTML views, PDF and ePub downloads, according to the available data) and Abstracts Views on Vision4Press platform.
Data correspond to usage on the plateform after 2015. The current usage metrics is available 48-96 hours after online publication and is updated daily on week days.
Initial download of the metrics may take a while.