Fig. 8.
Download original image
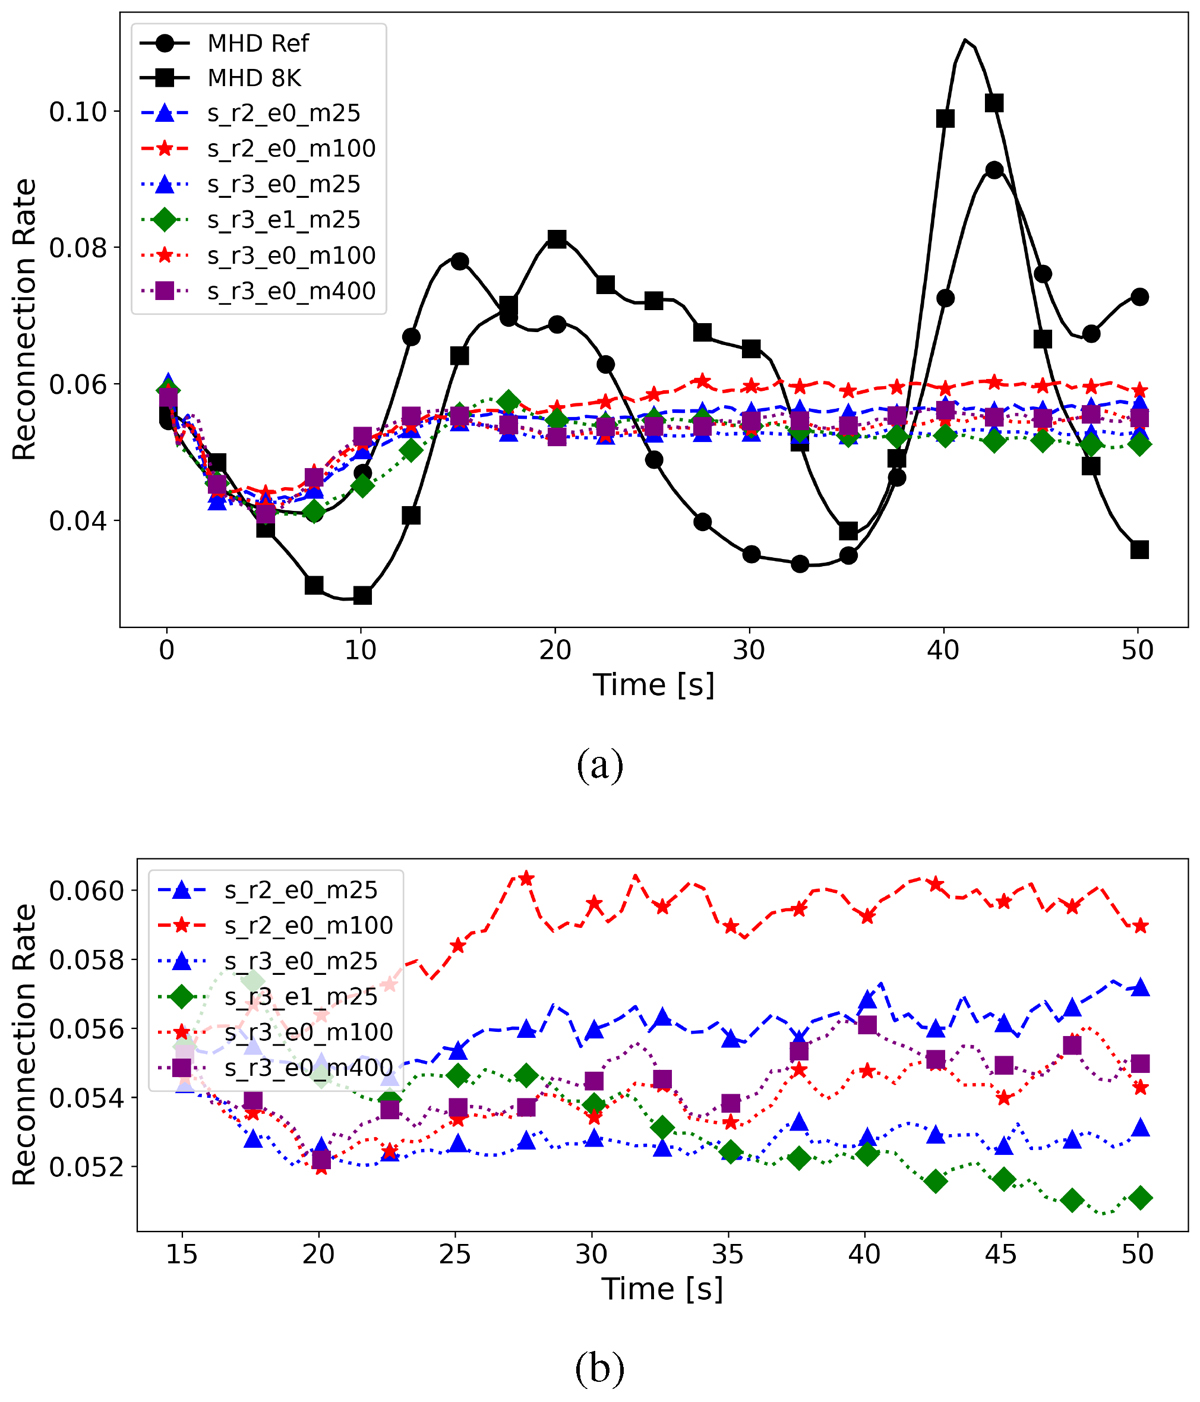
Normalised reconnection rate evolution. Panel (a): Time evolution of the normalised reconnection rate for the 2K and 8K MHD simulations and selected PIC runs. Panel (b): Zoom-in on the PIC runs between t = 15 and 50 s (after the ejection of the initial plasmoid), showing the more stable reconnection rate after the initial collapse.
Current usage metrics show cumulative count of Article Views (full-text article views including HTML views, PDF and ePub downloads, according to the available data) and Abstracts Views on Vision4Press platform.
Data correspond to usage on the plateform after 2015. The current usage metrics is available 48-96 hours after online publication and is updated daily on week days.
Initial download of the metrics may take a while.