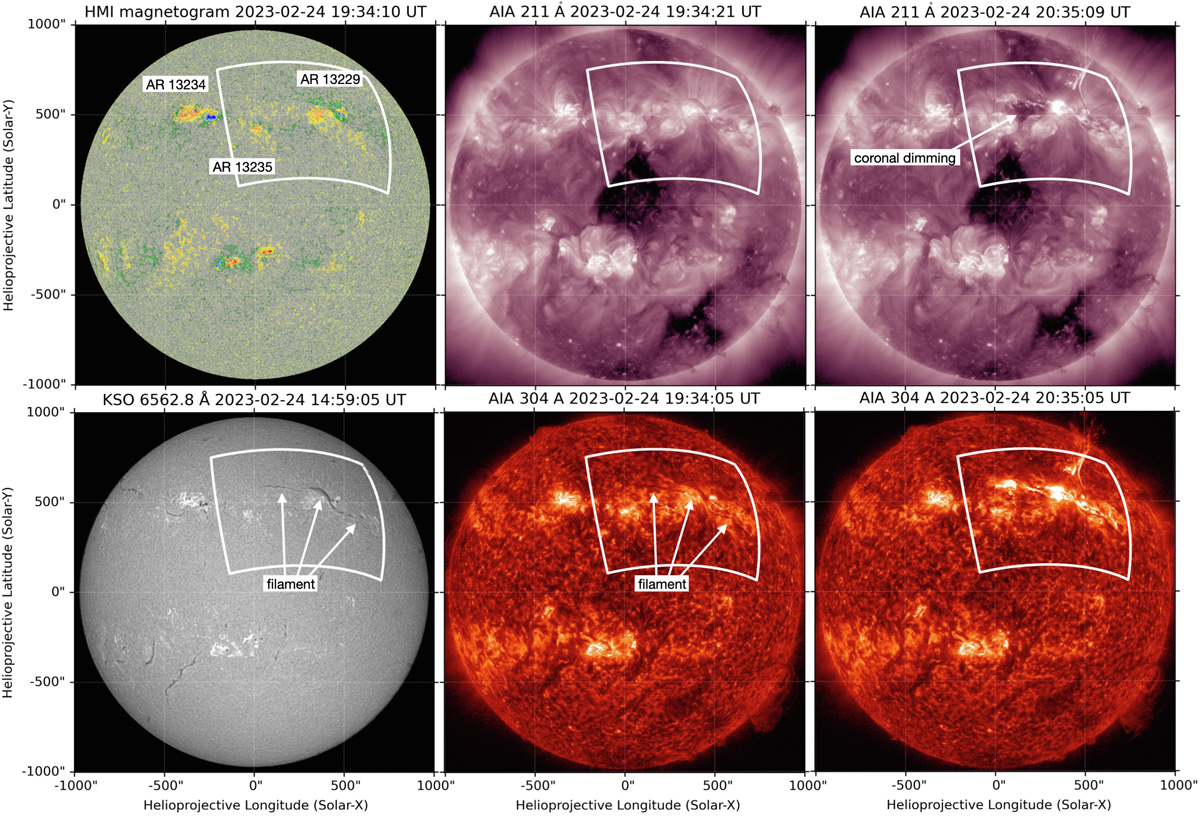
Fig. 1.
Download original image
Extent of the bottom boundary of the extrapolation volume (white contours; a rectangle in CEA coordinates) compared with selected full-disk observations before (first and second columns) and during the filament eruption (third column). The pre-eruption SDO/HMI LOS magnetogram and the SDO/AIA 211 Å and 304 Å images, match the time of our NLFFF extrapolation (19:34 UT). The KSO Hα image was recorded at 14:59 UT.
Current usage metrics show cumulative count of Article Views (full-text article views including HTML views, PDF and ePub downloads, according to the available data) and Abstracts Views on Vision4Press platform.
Data correspond to usage on the plateform after 2015. The current usage metrics is available 48-96 hours after online publication and is updated daily on week days.
Initial download of the metrics may take a while.